OPEN-SOURCE SCRIPT
업데이트됨 Multiple MA Dashboard [PUCHON]
📊 Multiple MA Dashboard [PUCHON]
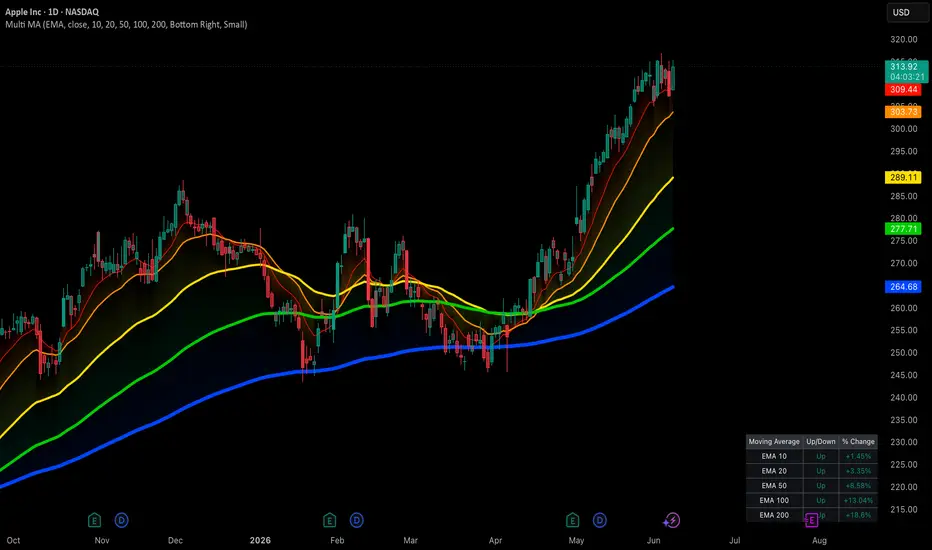
The Multiple MA Dashboard plots up to 5 moving averages of a chosen type (EMA, SMA, WMA, or RMA) directly on your chart and summarizes their relationship to price in a clean, real-time table. Instead of eyeballing where price sits relative to each average, this indicator gives you an instant Up/Down read and the exact percentage distance for every MA.
✨ Features:
- 📈 5 Configurable Moving Averages: Set independent lengths (defaults: 10, 20, 50, 100, 200) sharing one MA type and source.
- 🔁 Switchable MA Type: Choose between EMA, SMA, WMA, and RMA from a single dropdown — all 5 lines update together.
- 📋 Live Dashboard Table: Displays each MA's label, trend direction (Up/Down), and percentage distance from price, refreshed on the latest bar.
- 🎨 Dynamic Trend Coloring: Lines, fills, and table text automatically switch between your chosen "Up" and "Down" colors based on whether price is above or below each MA.
- 🌈 Price-to-MA Fill Zones: Shaded regions between price and each MA make the gap easy to see at a glance.
- ⚙️ Fully Customizable: Adjust MA lengths, source, dashboard position, text size, and theme colors to fit your setup.
🧮 Calculation Logic:
The core getMa function selects the moving average algorithm based on the user's choice, while each MA's color and table row are derived from a simple comparison between price and that MA.
Pine Script®
💡 Interpretation:
- 🟢 Up (price > MA): Price is trading above the average — shown in your "Up Trend" color with a positive % distance.
- 🔴 Down (price < MA): Price is trading below the average — shown in your "Down Trend" color with a negative % distance.
- 📏 % Change: The percentage gap between price and each MA, useful for gauging how stretched or compressed price is relative to that average.
⚠️ Disclaimer:
This tool is provided for educational and informational purposes only. It does not constitute financial advice and does not guarantee future performance. Always combine it with your own analysis and proper risk management.
The Multiple MA Dashboard plots up to 5 moving averages of a chosen type (EMA, SMA, WMA, or RMA) directly on your chart and summarizes their relationship to price in a clean, real-time table. Instead of eyeballing where price sits relative to each average, this indicator gives you an instant Up/Down read and the exact percentage distance for every MA.
✨ Features:
- 📈 5 Configurable Moving Averages: Set independent lengths (defaults: 10, 20, 50, 100, 200) sharing one MA type and source.
- 🔁 Switchable MA Type: Choose between EMA, SMA, WMA, and RMA from a single dropdown — all 5 lines update together.
- 📋 Live Dashboard Table: Displays each MA's label, trend direction (Up/Down), and percentage distance from price, refreshed on the latest bar.
- 🎨 Dynamic Trend Coloring: Lines, fills, and table text automatically switch between your chosen "Up" and "Down" colors based on whether price is above or below each MA.
- 🌈 Price-to-MA Fill Zones: Shaded regions between price and each MA make the gap easy to see at a glance.
- ⚙️ Fully Customizable: Adjust MA lengths, source, dashboard position, text size, and theme colors to fit your setup.
🧮 Calculation Logic:
The core getMa function selects the moving average algorithm based on the user's choice, while each MA's color and table row are derived from a simple comparison between price and that MA.
💡 Interpretation:
- 🟢 Up (price > MA): Price is trading above the average — shown in your "Up Trend" color with a positive % distance.
- 🔴 Down (price < MA): Price is trading below the average — shown in your "Down Trend" color with a negative % distance.
- 📏 % Change: The percentage gap between price and each MA, useful for gauging how stretched or compressed price is relative to that average.
⚠️ Disclaimer:
This tool is provided for educational and informational purposes only. It does not constitute financial advice and does not guarantee future performance. Always combine it with your own analysis and proper risk management.
릴리즈 노트
Updated: Able to adjust color on MA릴리즈 노트
Fixed: Name오픈 소스 스크립트
트레이딩뷰의 진정한 정신에 따라, 이 스크립트의 작성자는 이를 오픈소스로 공개하여 트레이더들이 기능을 검토하고 검증할 수 있도록 했습니다. 작성자에게 찬사를 보냅니다! 이 코드는 무료로 사용할 수 있지만, 코드를 재게시하는 경우 하우스 룰이 적용된다는 점을 기억하세요.

면책사항
해당 정보와 게시물은 금융, 투자, 트레이딩 또는 기타 유형의 조언이나 권장 사항으로 간주되지 않으며, 트레이딩뷰에서 제공하거나 보증하는 것이 아닙니다. 자세한 내용은 이용 약관을 참조하세요.
오픈 소스 스크립트
트레이딩뷰의 진정한 정신에 따라, 이 스크립트의 작성자는 이를 오픈소스로 공개하여 트레이더들이 기능을 검토하고 검증할 수 있도록 했습니다. 작성자에게 찬사를 보냅니다! 이 코드는 무료로 사용할 수 있지만, 코드를 재게시하는 경우 하우스 룰이 적용된다는 점을 기억하세요.
면책사항
해당 정보와 게시물은 금융, 투자, 트레이딩 또는 기타 유형의 조언이나 권장 사항으로 간주되지 않으며, 트레이딩뷰에서 제공하거나 보증하는 것이 아닙니다. 자세한 내용은 이용 약관을 참조하세요.