Liquidity Swings [ Zero Lag ] - FloAlgo
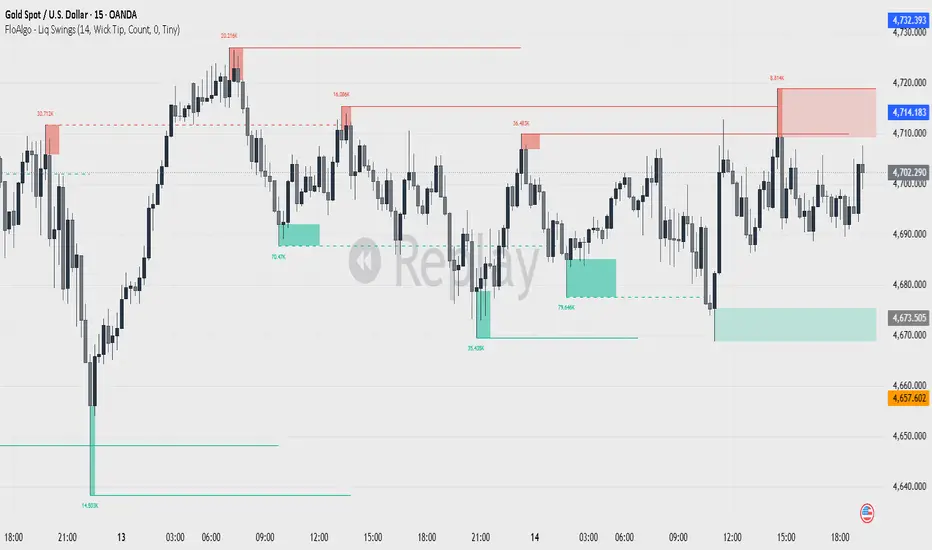
This indicator identifies and tracks liquidity pools at swing highs and lows — a key Smart Money Concepts tool for visualizing institutional order flow and potential reversal zones.
How It Works
The script operates in three stages:
Visual Elements
Key Settings
How It Works
The script operates in three stages:
- Pivot Detection — Confirmed swing highs and lows are identified using a lookback period, establishing the outer boundaries of resting liquidity pools.
- Zone Tracking — For each pivot, the script counts how many subsequent bars trade through the liquidity zone (wick tip to body edge) and accumulates the total volume of those touches, revealing market interest at each level.
- Cross Event — When price closes beyond a pivot's extreme, the level is marked as "consumed" — liquidity has been taken and the level becomes a dashed historical reference rather than an active trading zone.
Visual Elements
- Solid horizontal lines extending from pivot levels to current price
- Semi-transparent zone boxes spanning from wick tip to body edge
- Dashed lines marking levels where liquidity has been consumed
- Volume/count labels pinned at pivot bars showing accumulated activity
- Color-coded zones: red for supply (highs), green for demand (lows)
Key Settings
- Pivot Lookback — Sensitivity of pivot high/low detection
- Swing Area — Zone definition: Wick Tip to body edge, or Full Range (wick to opposite wick)
- Filter Areas By — Display threshold metric: Count (number of touches) or Volume (total volume)
- Filter Value — Minimum threshold — zones only appear when activity exceeds this value
- Swing High/Low — Toggle visibility of supply or demand zones
- Label Size — Size of volume/count labels displayed on chart

면책사항
해당 정보와 게시물은 금융, 투자, 트레이딩 또는 기타 유형의 조언이나 권장 사항으로 간주되지 않으며, 트레이딩뷰에서 제공하거나 보증하는 것이 아닙니다. 자세한 내용은 이용 약관을 참조하세요.
면책사항
해당 정보와 게시물은 금융, 투자, 트레이딩 또는 기타 유형의 조언이나 권장 사항으로 간주되지 않으며, 트레이딩뷰에서 제공하거나 보증하는 것이 아닙니다. 자세한 내용은 이용 약관을 참조하세요.