Volume Delta Pivot Matrix with alerts
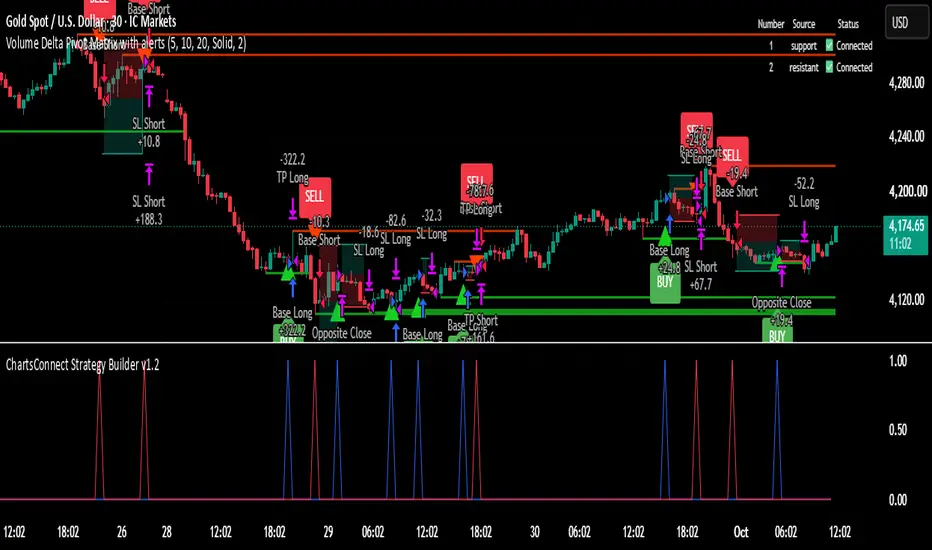
Volume Delta Pivot Matrix with Alerts
Based on the original "Volume Delta Pivot Matrix" by BigBeluga.
Original script: BigBeluga,
OVERVIEW
This indicator finds swing-based support and resistance levels and grades each one by how much buying or selling volume formed it. Only levels with enough volume behind them are kept. This version is built for automation: it doesn't repaint, and every point on the chart matches a signal you can use in TradingView alerts.
HOW IT WORKS
1. Pivot detection
A swing low becomes a support candidate and a swing high becomes a resistance candidate. A swing is the lowest low (or highest high) with "Pivot Swing Length" candles on each side (default 5).
2. Volume delta
For every candle in the pivot window, volume counts as buying or selling depending on where the candle closed within its range. A close near the high counts as buying, a close near the low counts as selling. Adding these up gives the level's volume delta.
3. Strength filter
Each new level's delta is compared with the strongest delta among the currently active levels, giving a strength %. The level is accepted only if it meets the "Minimum Delta % Filter". This % is calculated once, when the point forms, and never changes afterwards.
4. Signal and marker
When a level is accepted:
• Support: a small green ▲ is drawn at the level, and "Support Point" = 1
• Resistance: a small red ▼ is drawn at the level, and "Resistance Point" = 1
The marker appears on the candle where the swing is confirmed, which is "Pivot Swing Length" candles after the actual high or low. The level line starts back at the original swing candle.
5. Level management
• A level is broken when a candle closes through it. Its line stops at that candle and is left on the chart.
• Only the newest "Max Active Levels" stay active and keep extending.
AMENDMENTS FROM THE ORIGINAL
- Non-repainting. The original redrew all levels and recalculated their % on the latest candle, so the chart showed only levels that survived, judged with hindsight. This version decides everything in real time, on confirmed candles only.
- Broken levels are kept on the chart instead of deleted, so you can see every level that was ever signalled.
- The multi-size yellow delta circles and the price/delta text labels are replaced with simple ▲ / ▼ markers. Hover over a marker to see its price, delta and strength %.
- Two Strategy Builder outputs added: "Support Point" and "Resistance Point" (1 on the signal candle, 0 otherwise). They line up exactly with the markers on the chart.
- Two alert conditions added: "Support Point" and "Resistance Point", for webhook automation.
- Settings simplified. A "Show Level Lines" toggle was added.
SETTINGS
- Pivot Swing Length: candles on each side needed to confirm a swing. Higher means fewer, more significant levels but a later signal.
- Max Active Levels: how many recent levels stay active at once.
- Minimum Delta % Filter: raise this for fewer, stronger points.
- Colours, line style, line width, and level lines on/off.
Based on the original "Volume Delta Pivot Matrix" by BigBeluga.
Original script: BigBeluga,
OVERVIEW
This indicator finds swing-based support and resistance levels and grades each one by how much buying or selling volume formed it. Only levels with enough volume behind them are kept. This version is built for automation: it doesn't repaint, and every point on the chart matches a signal you can use in TradingView alerts.
HOW IT WORKS
1. Pivot detection
A swing low becomes a support candidate and a swing high becomes a resistance candidate. A swing is the lowest low (or highest high) with "Pivot Swing Length" candles on each side (default 5).
2. Volume delta
For every candle in the pivot window, volume counts as buying or selling depending on where the candle closed within its range. A close near the high counts as buying, a close near the low counts as selling. Adding these up gives the level's volume delta.
3. Strength filter
Each new level's delta is compared with the strongest delta among the currently active levels, giving a strength %. The level is accepted only if it meets the "Minimum Delta % Filter". This % is calculated once, when the point forms, and never changes afterwards.
4. Signal and marker
When a level is accepted:
• Support: a small green ▲ is drawn at the level, and "Support Point" = 1
• Resistance: a small red ▼ is drawn at the level, and "Resistance Point" = 1
The marker appears on the candle where the swing is confirmed, which is "Pivot Swing Length" candles after the actual high or low. The level line starts back at the original swing candle.
5. Level management
• A level is broken when a candle closes through it. Its line stops at that candle and is left on the chart.
• Only the newest "Max Active Levels" stay active and keep extending.
AMENDMENTS FROM THE ORIGINAL
- Non-repainting. The original redrew all levels and recalculated their % on the latest candle, so the chart showed only levels that survived, judged with hindsight. This version decides everything in real time, on confirmed candles only.
- Broken levels are kept on the chart instead of deleted, so you can see every level that was ever signalled.
- The multi-size yellow delta circles and the price/delta text labels are replaced with simple ▲ / ▼ markers. Hover over a marker to see its price, delta and strength %.
- Two Strategy Builder outputs added: "Support Point" and "Resistance Point" (1 on the signal candle, 0 otherwise). They line up exactly with the markers on the chart.
- Two alert conditions added: "Support Point" and "Resistance Point", for webhook automation.
- Settings simplified. A "Show Level Lines" toggle was added.
SETTINGS
- Pivot Swing Length: candles on each side needed to confirm a swing. Higher means fewer, more significant levels but a later signal.
- Max Active Levels: how many recent levels stay active at once.
- Minimum Delta % Filter: raise this for fewer, stronger points.
- Colours, line style, line width, and level lines on/off.

면책사항
해당 정보와 게시물은 금융, 투자, 트레이딩 또는 기타 유형의 조언이나 권장 사항으로 간주되지 않으며, 트레이딩뷰에서 제공하거나 보증하는 것이 아닙니다. 자세한 내용은 이용 약관을 참조하세요.
면책사항
해당 정보와 게시물은 금융, 투자, 트레이딩 또는 기타 유형의 조언이나 권장 사항으로 간주되지 않으며, 트레이딩뷰에서 제공하거나 보증하는 것이 아닙니다. 자세한 내용은 이용 약관을 참조하세요.