OPEN-SOURCE SCRIPT
SigmaSpikes Background Highlight [vnhilton]
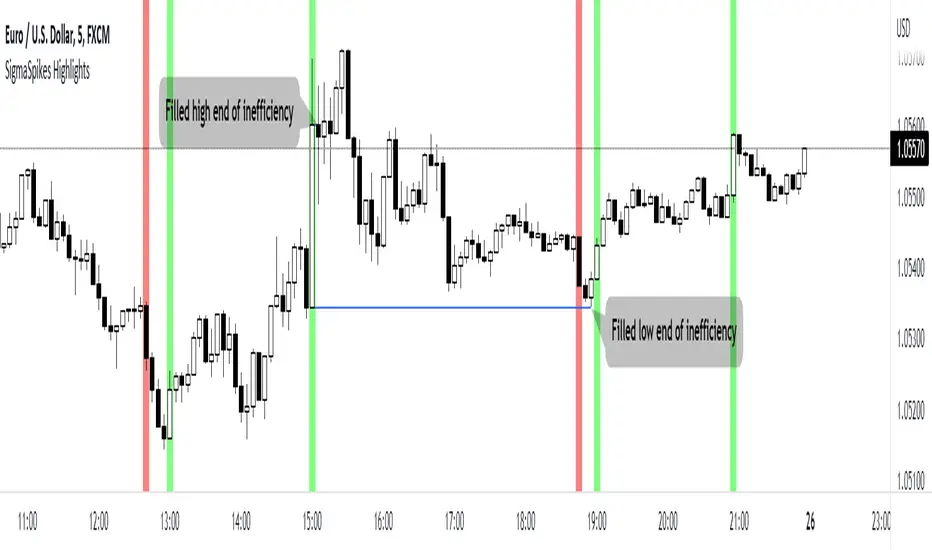
SigmaSpikes is an indicator created by Adam H Grimes. It's a volatility indicator which applies a standard deviation measure on candles for a set period of time, in order to find big candles/moves relative to the other candles. These big moves could be the outcome of setups being traded by market players, large market orders put in by big money players, &/or HFT algorithms reacting to events (usually fundamental events).
These big moves can also be seen as inefficient as it doesn't fit in with the mostly efficient market - this is very similar to gaps of which price would want to fill as they're inefficient, in order to "restore order" to the market.
This indicator attempts to give better information at a glance, by highlighting the background of candles that have sigma spikes over the set standard deviation threshold.
In the chart snapshot image above featuring EURUSD, we can see at 24/06/22 3PM BST, a big move has occurred (highlighted in green showing upward move) leaving an inefficiency area that needs to be filled. The high end of the inefficiency area was reached in the following candle as there was no gap between that candle's open & the previous big candle's close. The low end of the inefficiency area was finally reached almost 4 hours later, at 6:55PM BST.
These big moves can also be seen as inefficient as it doesn't fit in with the mostly efficient market - this is very similar to gaps of which price would want to fill as they're inefficient, in order to "restore order" to the market.
This indicator attempts to give better information at a glance, by highlighting the background of candles that have sigma spikes over the set standard deviation threshold.
In the chart snapshot image above featuring EURUSD, we can see at 24/06/22 3PM BST, a big move has occurred (highlighted in green showing upward move) leaving an inefficiency area that needs to be filled. The high end of the inefficiency area was reached in the following candle as there was no gap between that candle's open & the previous big candle's close. The low end of the inefficiency area was finally reached almost 4 hours later, at 6:55PM BST.
오픈 소스 스크립트
트레이딩뷰의 진정한 정신에 따라, 이 스크립트의 작성자는 이를 오픈소스로 공개하여 트레이더들이 기능을 검토하고 검증할 수 있도록 했습니다. 작성자에게 찬사를 보냅니다! 이 코드는 무료로 사용할 수 있지만, 코드를 재게시하는 경우 하우스 룰이 적용된다는 점을 기억하세요.

면책사항
해당 정보와 게시물은 금융, 투자, 트레이딩 또는 기타 유형의 조언이나 권장 사항으로 간주되지 않으며, 트레이딩뷰에서 제공하거나 보증하는 것이 아닙니다. 자세한 내용은 이용 약관을 참조하세요.
오픈 소스 스크립트
트레이딩뷰의 진정한 정신에 따라, 이 스크립트의 작성자는 이를 오픈소스로 공개하여 트레이더들이 기능을 검토하고 검증할 수 있도록 했습니다. 작성자에게 찬사를 보냅니다! 이 코드는 무료로 사용할 수 있지만, 코드를 재게시하는 경우 하우스 룰이 적용된다는 점을 기억하세요.
면책사항
해당 정보와 게시물은 금융, 투자, 트레이딩 또는 기타 유형의 조언이나 권장 사항으로 간주되지 않으며, 트레이딩뷰에서 제공하거나 보증하는 것이 아닙니다. 자세한 내용은 이용 약관을 참조하세요.