Pro Scalper: Kalman Supertrend + VWMA Zones
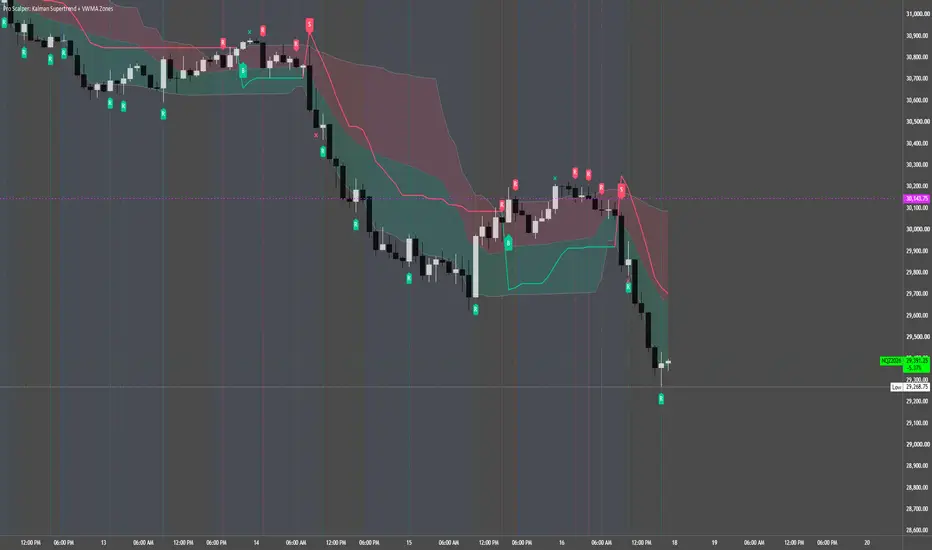
Pro Scalper combines a Kalman-smoothed Supertrend-style trend model with volume-weighted price zones, potential reversal markers, and zone-based take-profit reference markers.
The indicator separates three types of information:
- B / S labels: Changes in the trend model’s direction.
- R labels: Potential reversals following a zone touch.
- X markers: Zone-based exit references after a directional signal.
These components provide complementary context. Reversal and take-profit markers do not act as mandatory filters for the B / S signals.
KALMAN-SMOOTHED TREND MODEL
The script applies a recursive scalar Kalman filter to HLC3, the average of the high, low, and close.
The filter updates its price estimate using an error estimate, process noise, and measurement noise. The “Kalman Gain” input controls the measurement-noise calculation; it is not the actual update gain, which the script calculates internally.
An adapted Supertrend calculation then builds trailing bands around the filtered price using ATR.
Default settings:
- Kalman Gain input: 0.35
- Kalman Process Noise: 0.8
- ATR Length: 10
- ATR Multiplier: 2.5
ATR is calculated from the chart’s standard price data, not from synthetic Kalman-filtered candles.
The trend line uses the lower trailing band during bullish conditions and the upper trailing band during bearish conditions.
BUY AND SELL SIGNALS
- B — Buy: The previous trend state was bearish and the current close moves above the previous upper trailing band.
- S — Sell: The previous trend state was bullish and the current close moves below the previous lower trailing band.
Labels appear when the trend direction changes, not on every candle of an established trend.
The VWMA zones do not filter these signals. A B or S label represents a change in the trend model, not a guaranteed entry opportunity.
VWMA PRICE ZONES
The zone center is a volume-weighted moving average of closing prices.
The outer bands use the distance between that center and the highest high or lowest low over the selected lookback:
Upper Zone = Center + max(Highest High − Center, 0) × Upper Multiplier ÷ 2
Lower Zone = Center − max(Center − Lowest Low, 0) × Lower Multiplier ÷ 2
Default settings:
- VWMA Length: 20
- High/Low Lookback: 20
- Upper Band Multiplier: 1.5
- Lower Band Multiplier: 1.5
The distance calculations are clamped at zero to prevent the upper and lower bands from inverting around the center.
If the VWMA calculation is unavailable, the script falls back to an SMA of closing prices. Both calculations still require sufficient historical data.
The shaded areas provide relative price-location context. “Overbought” and “oversold” are descriptive labels, not guarantees that price will reverse.
POTENTIAL REVERSAL MARKERS — R
Reversal detection uses separate armed states for the upper and lower zones.
- Potential downward reversal: A prior upper-zone touch arms the condition. A later bearish candle closing below the current upper zone produces a downward R marker.
- Potential upward reversal: A prior lower-zone touch arms the condition. A later bullish candle closing above the current lower zone produces an upward R marker.
A qualifying reversal disarms its corresponding condition. Another zone touch is required to arm it again.
These armed conditions have no fixed expiration. An R marker may therefore appear several bars after the original touch, and it does not require a return all the way to the center line.
Optional dotted vertical lines highlight reversal bars.
The “Show Reversal Lines” setting controls the vertical lines only. R labels and reversal alert conditions remain active when those lines are hidden.
Reversal markers are independent of the current Supertrend direction and do not automatically close or reverse a position.
TAKE-PROFIT REFERENCE MARKERS — X
After a B signal, the script records the signal candle’s high and arms a long-side reference.
A long-side X appears when:
- Price touches the upper zone.
- The current high exceeds the recorded buy-signal candle’s high.
After an S signal, the script records the signal candle’s low and arms a short-side reference.
A short-side X appears when:
- Price touches the lower zone.
- The current low falls below the recorded sell-signal candle’s low.
Each directional signal can produce at most one corresponding X marker. An opposite B / S signal replaces the active directional state.
X markers are not fixed profit targets or verified profitable exits. They compare candle extremes and zone touches—not entry-to-exit returns. A marker does not confirm that a position was opened or closed at a profit.
The script does not submit orders, calculate trade size, or provide stop-loss levels.
ALERTS
Separate alert conditions are available for:
- Buy signal.
- Sell signal.
- Potential upward reversal.
- Potential downward reversal.
- Long-side take-profit reference.
- Short-side take-profit reference.
Turning off “Show Take Profit X Markers” also disables the corresponding take-profit conditions and alerts.
For close-based notifications, select “Once Per Bar Close” when creating an alert.
HOW THE COMPONENTS WORK TOGETHER
The trend model supplies directional context, the VWMA zones describe relative price location, and the R markers identify qualifying reactions after zone touches.
X markers add a separate exit-planning reference following a B or S signal.
These calculations are rule-based. The indicator does not use machine learning, order-book data, institutional positioning, or multi-symbol scanning.
SUGGESTED WORKFLOW
- Review the Kalman Supertrend line for the current directional state.
- Use the VWMA center and zones to assess price location.
- Evaluate B / S transitions alongside market structure and your own analysis.
- Treat R labels as potential reactions, not automatic reversal entries.
- Use X markers only as supplementary exit references within an independently defined risk plan.
Although named “Pro Scalper,” the script does not enforce a particular chart interval or prove suitability for scalping. Settings should be evaluated separately for each instrument and timeframe.
LIVE-BAR BEHAVIOR AND LIMITATIONS
Signals are not explicitly restricted to closed candles.
The filtered price, ATR bands, zones, and markers can change while the current candle develops. A signal visible intrabar may disappear before the candle closes. The indicator should not be described as non-repainting.
The trend model can lag price and generate repeated direction changes in sideways markets. Zone touches can persist during strong trends without producing a sustained reversal.
This is an indicator, not a backtesting strategy. It does not calculate verified win rate, profitability, drawdown, or execution-adjusted returns.
DISCLAIMER
For educational and analytical use only. This indicator does not provide personalized financial advice or guarantee trading results. Users are responsible for their own analysis, risk management, position sizing, and execution decisions.

면책사항
해당 정보와 게시물은 금융, 투자, 트레이딩 또는 기타 유형의 조언이나 권장 사항으로 간주되지 않으며, 트레이딩뷰에서 제공하거나 보증하는 것이 아닙니다. 자세한 내용은 이용 약관을 참조하세요.
면책사항
해당 정보와 게시물은 금융, 투자, 트레이딩 또는 기타 유형의 조언이나 권장 사항으로 간주되지 않으며, 트레이딩뷰에서 제공하거나 보증하는 것이 아닙니다. 자세한 내용은 이용 약관을 참조하세요.