OPEN-SOURCE SCRIPT
업데이트됨 XAUUSD Lot Size Calculator
1. What This Indicator Does
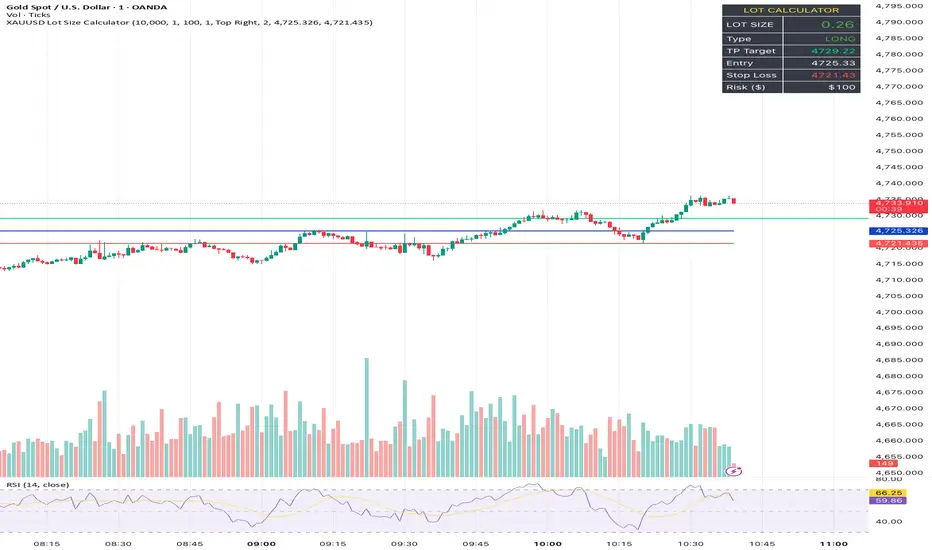
This tool is a Visual Risk Management System. Instead of using a calculator on your phone or switching tabs, it allows you to calculate the exact lot size for your trade directly on the TradingView chart by dragging lines.
It automates the math for:
Lot Size: How big your position should be to risk exactly X% of your account.
Take Profit: Where your target should be based on your Risk-to-Reward ratio.
Safety Checks: It warns you if your stop loss is too tight for the minimum lot size (0.01).
2. Visual Features
🔴 The Red Line (Stop Loss): This is your interactive line. You can grab it with your mouse and drag it to your desired invalidation point (e.g., below a support wick).
🟢 The Green Line (Take Profit): This line moves automatically. You cannot drag it. It calculates where your Take Profit must be to satisfy your Risk:Reward ratio (Default 1:1) based on where you placed the Red line.
⚫ The Info Table: A high-contrast black box in the corner that displays your calculated Lot Size, Risk amount, and Trade direction (Long/Short).
3. How to Use It (Step-by-Step)
Step 1: Initial Setup
When you first add the indicator to the chart, you need to tell it about your account:
Double-click the Black Table (or the Red Line) to open Settings.
Inputs Tab:
Account Balance: Enter your current trading balance (e.g., 10,000).
Risk %: Enter how much you want to lose per trade (e.g., 1.0%).
Contract Size: Keep this at 100 for Gold (XAUUSD) or standard Forex pairs.
Risk : Reward Ratio: Set your target (e.g., 1.0 for 1:1, or 2.0 for 1:2).
Step 2: Planning a Trade
Look at the chart and identify where you want to enter (current price) and where you want your Stop Loss.
Find the Red Line on your chart. (If you don't see it, go to Settings and change "Stop Loss Level" to a price near the current candle).
Click and Drag the Red Line to your specific Stop Loss price.
Step 3: Reading the Signals
Direction: If you drag the Red Line below the price, the table shows LONG. If you drag it above, it shows SHORT.
Lot Size: Read the big green number in the table (e.g., 0.55). This is the exact lot size you should enter in your broker.
TP Target: Look at the Green Line on the chart. That is your exit price.
Step 4: The "Orange Warning"
If you place your Stop Loss very close to the entry, or if your account is small, the math might suggest a lot size smaller than is possible (e.g., 0.004).
The table text will turn ORANGE.
The Lot Size will stick to 0.01 (the minimum).
The "Risk ($)" row will show you the actual risk. (Example: Instead of risking your desired $100, you might be forced to risk $105 because you can't trade smaller than 0.01 lots).
This tool is a Visual Risk Management System. Instead of using a calculator on your phone or switching tabs, it allows you to calculate the exact lot size for your trade directly on the TradingView chart by dragging lines.
It automates the math for:
Lot Size: How big your position should be to risk exactly X% of your account.
Take Profit: Where your target should be based on your Risk-to-Reward ratio.
Safety Checks: It warns you if your stop loss is too tight for the minimum lot size (0.01).
2. Visual Features
🔴 The Red Line (Stop Loss): This is your interactive line. You can grab it with your mouse and drag it to your desired invalidation point (e.g., below a support wick).
🟢 The Green Line (Take Profit): This line moves automatically. You cannot drag it. It calculates where your Take Profit must be to satisfy your Risk:Reward ratio (Default 1:1) based on where you placed the Red line.
⚫ The Info Table: A high-contrast black box in the corner that displays your calculated Lot Size, Risk amount, and Trade direction (Long/Short).
3. How to Use It (Step-by-Step)
Step 1: Initial Setup
When you first add the indicator to the chart, you need to tell it about your account:
Double-click the Black Table (or the Red Line) to open Settings.
Inputs Tab:
Account Balance: Enter your current trading balance (e.g., 10,000).
Risk %: Enter how much you want to lose per trade (e.g., 1.0%).
Contract Size: Keep this at 100 for Gold (XAUUSD) or standard Forex pairs.
Risk : Reward Ratio: Set your target (e.g., 1.0 for 1:1, or 2.0 for 1:2).
Step 2: Planning a Trade
Look at the chart and identify where you want to enter (current price) and where you want your Stop Loss.
Find the Red Line on your chart. (If you don't see it, go to Settings and change "Stop Loss Level" to a price near the current candle).
Click and Drag the Red Line to your specific Stop Loss price.
Step 3: Reading the Signals
Direction: If you drag the Red Line below the price, the table shows LONG. If you drag it above, it shows SHORT.
Lot Size: Read the big green number in the table (e.g., 0.55). This is the exact lot size you should enter in your broker.
TP Target: Look at the Green Line on the chart. That is your exit price.
Step 4: The "Orange Warning"
If you place your Stop Loss very close to the entry, or if your account is small, the math might suggest a lot size smaller than is possible (e.g., 0.004).
The table text will turn ORANGE.
The Lot Size will stick to 0.01 (the minimum).
The "Risk ($)" row will show you the actual risk. (Example: Instead of risking your desired $100, you might be forced to risk $105 because you can't trade smaller than 0.01 lots).
릴리즈 노트
RELEASE NOTES: v2.1 - Interactive Entry Line AddedNew Feature: Custom Entry Price
- Added a draggable "Entry Line" (Black) to the chart.
- You can now drag this line to plan your entry price for pending orders.
- Lot size is now calculated based on the specific distance between your dragged Entry Line and Stop Loss line.
UI Updates:
- Table is now solid black with high-visibility white text.
- Table width is fixed so it remains stable when numbers change.
오픈 소스 스크립트
트레이딩뷰의 진정한 정신에 따라, 이 스크립트의 작성자는 이를 오픈소스로 공개하여 트레이더들이 기능을 검토하고 검증할 수 있도록 했습니다. 작성자에게 찬사를 보냅니다! 이 코드는 무료로 사용할 수 있지만, 코드를 재게시하는 경우 하우스 룰이 적용된다는 점을 기억하세요.

면책사항
해당 정보와 게시물은 금융, 투자, 트레이딩 또는 기타 유형의 조언이나 권장 사항으로 간주되지 않으며, 트레이딩뷰에서 제공하거나 보증하는 것이 아닙니다. 자세한 내용은 이용 약관을 참조하세요.
오픈 소스 스크립트
트레이딩뷰의 진정한 정신에 따라, 이 스크립트의 작성자는 이를 오픈소스로 공개하여 트레이더들이 기능을 검토하고 검증할 수 있도록 했습니다. 작성자에게 찬사를 보냅니다! 이 코드는 무료로 사용할 수 있지만, 코드를 재게시하는 경우 하우스 룰이 적용된다는 점을 기억하세요.
면책사항
해당 정보와 게시물은 금융, 투자, 트레이딩 또는 기타 유형의 조언이나 권장 사항으로 간주되지 않으며, 트레이딩뷰에서 제공하거나 보증하는 것이 아닙니다. 자세한 내용은 이용 약관을 참조하세요.