OPEN-SOURCE SCRIPT
Fear & Greed Index
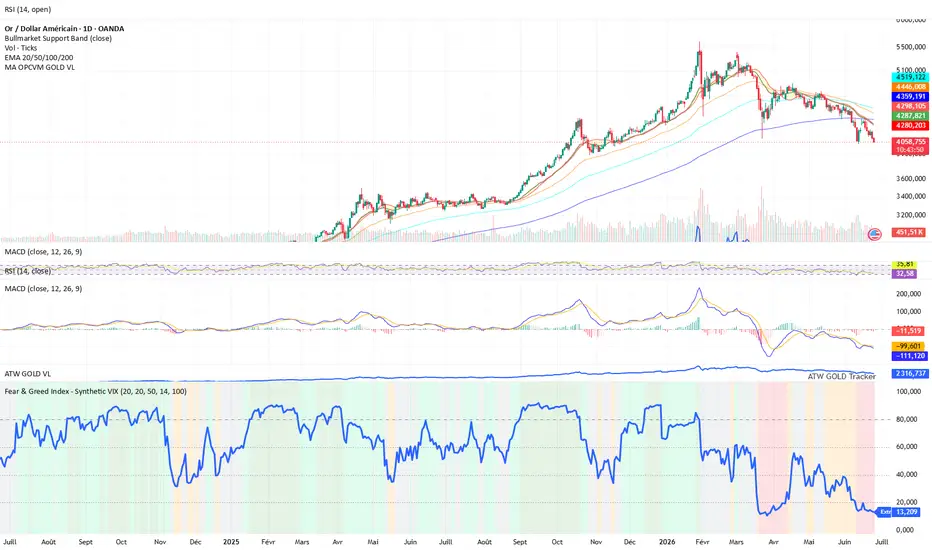
The Fear & Greed Index is a synthetic market sentiment indicator designed to convert multiple technical signals into a single 0–100 score.
Its purpose is to quickly identify market phases of fear, neutrality, or greed across any asset or index.
This indicator does not rely on an official VIX.
Instead, it uses synthetic realized volatility, combined with trend and momentum metrics, to provide a visual reading of market sentiment and regime conditions.
Methodology
The score is built from several components:
Realized volatility
used as a market stress proxy: higher volatility pushes the index toward fear.
Momentum
captures recent price acceleration or deterioration.
RSI
evaluates market strength and overbought / oversold conditions.
Trend vs moving average
compares current price to its moving average to assess directional bias.
Drawdown
measures the distance from recent highs to identify stress, correction, or recovery phases.
Score interpretation
The final score is normalized between 0 and 100:
0 – 20 → Extreme Fear
20 – 40 → Fear
40 – 60 → Neutral
60 – 80 → Greed
80 – 100 → Extreme Greed
How to use it
Low readings usually reflect stressed, volatile, or corrective market conditions.
High readings usually reflect confident, bullish, or potentially overheated market conditions.
The indicator is best used as a market regime / sentiment filter, not as a standalone buy or sell signal.
Disclaimer
This script is a synthetic sentiment indicator based on price and volume data.
It is not an official volatility index and should not be considered investment advice.
Its purpose is to quickly identify market phases of fear, neutrality, or greed across any asset or index.
This indicator does not rely on an official VIX.
Instead, it uses synthetic realized volatility, combined with trend and momentum metrics, to provide a visual reading of market sentiment and regime conditions.
Methodology
The score is built from several components:
Realized volatility
used as a market stress proxy: higher volatility pushes the index toward fear.
Momentum
captures recent price acceleration or deterioration.
RSI
evaluates market strength and overbought / oversold conditions.
Trend vs moving average
compares current price to its moving average to assess directional bias.
Drawdown
measures the distance from recent highs to identify stress, correction, or recovery phases.
Score interpretation
The final score is normalized between 0 and 100:
0 – 20 → Extreme Fear
20 – 40 → Fear
40 – 60 → Neutral
60 – 80 → Greed
80 – 100 → Extreme Greed
How to use it
Low readings usually reflect stressed, volatile, or corrective market conditions.
High readings usually reflect confident, bullish, or potentially overheated market conditions.
The indicator is best used as a market regime / sentiment filter, not as a standalone buy or sell signal.
Disclaimer
This script is a synthetic sentiment indicator based on price and volume data.
It is not an official volatility index and should not be considered investment advice.
오픈 소스 스크립트
트레이딩뷰의 진정한 정신에 따라, 이 스크립트의 작성자는 이를 오픈소스로 공개하여 트레이더들이 기능을 검토하고 검증할 수 있도록 했습니다. 작성자에게 찬사를 보냅니다! 이 코드는 무료로 사용할 수 있지만, 코드를 재게시하는 경우 하우스 룰이 적용된다는 점을 기억하세요.

면책사항
해당 정보와 게시물은 금융, 투자, 트레이딩 또는 기타 유형의 조언이나 권장 사항으로 간주되지 않으며, 트레이딩뷰에서 제공하거나 보증하는 것이 아닙니다. 자세한 내용은 이용 약관을 참조하세요.
오픈 소스 스크립트
트레이딩뷰의 진정한 정신에 따라, 이 스크립트의 작성자는 이를 오픈소스로 공개하여 트레이더들이 기능을 검토하고 검증할 수 있도록 했습니다. 작성자에게 찬사를 보냅니다! 이 코드는 무료로 사용할 수 있지만, 코드를 재게시하는 경우 하우스 룰이 적용된다는 점을 기억하세요.
면책사항
해당 정보와 게시물은 금융, 투자, 트레이딩 또는 기타 유형의 조언이나 권장 사항으로 간주되지 않으며, 트레이딩뷰에서 제공하거나 보증하는 것이 아닙니다. 자세한 내용은 이용 약관을 참조하세요.