OPEN-SOURCE SCRIPT
Dynamic Price Oscillator Overlay (Zeiierman)
█ Overview
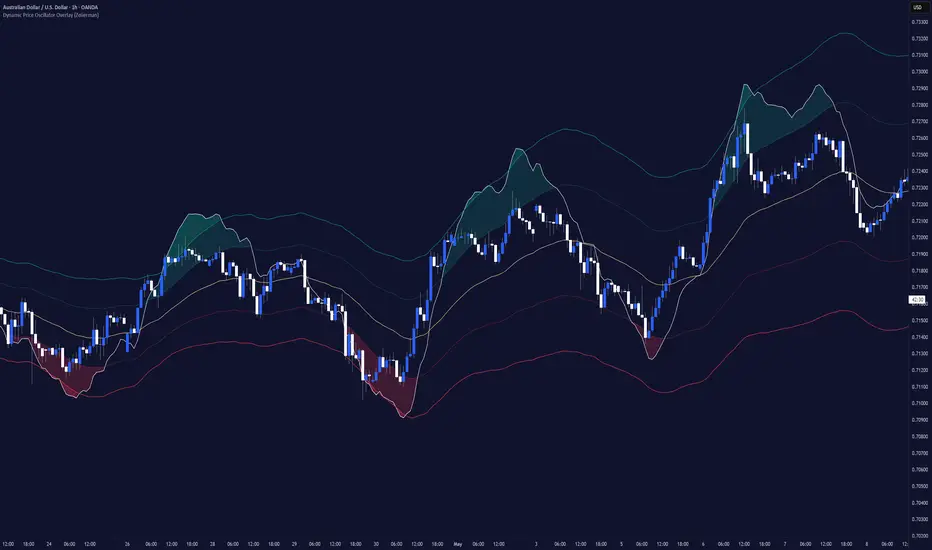
Dynamic Price Oscillator Overlay (Zeiierman) is a volatility-adjusted momentum overlay that transforms oscillator behavior directly onto the price chart.
Instead of displaying momentum in a separate pane, the indicator wraps a dynamic oscillator around an adaptive price anchor, allowing traders to visualize momentum expansion, contraction, and directional bias directly within price action.
The calculation combines long-term price displacement with volatility-adjusted movement and then applies Bollinger Band analysis to identify statistically stretched market conditions.
The result is a dynamic price-following structure that highlights momentum extremes, trend transitions, and overextended conditions while remaining visually integrated with the chart.

█ How It Works
⚪ Volatility-Adjusted Price Engine
The indicator begins by measuring market volatility using True Range.
Pine Script®
This creates a dynamic volatility component that adapts to changing market conditions.
⚪ Dual Momentum Calculation
The oscillator combines two independent measurements:
• Long-term price displacement
Pine Script®
• Volatility-adjusted price movement
Pine Script®
These components are blended together and smoothed.
Pine Script®
The result is a momentum engine that reacts to both directional movement and changing volatility.
⚪ Dynamic Oscillator Bands
The oscillator is surrounded by two Bollinger Band structures.
Standard bands identify elevated momentum conditions while expanded bands identify extreme momentum conditions.
Pine Script®
These bands create adaptive thresholds that expand and contract as market behavior changes.
⚪ Dynamic Mean
The indicator calculates a central equilibrium level using the midpoint of the expanded Bollinger Bands.
Pine Script®
This serves as the oscillator's primary trend reference.
⚪ Price Overlay Projection
Rather than plotting the oscillator separately, the indicator wraps the oscillator around a moving price anchor.
Pine Script®
The oscillator is projected directly onto the chart:
Pine Script®
This creates a momentum structure that follows price while preserving oscillator behavior.
█ How to Use
⚪ Dynamic Price Oscillator Overlay
• When the oscillator line remains above the Dynamic Mean, momentum conditions are generally bullish.
• When the oscillator line remains below the Dynamic Mean, momentum conditions are generally bearish.

⚪Mean Crosses
The Dynamic Mean acts as the primary trend reference.
• Bullish Cross:
The oscillator line crosses above the mean.
• Bearish Cross:
The oscillator line crosses below the mean.
These signals often represent transitions between bullish and bearish momentum regimes.

⚪Mean Retests
The Dynamic Mean acts as the primary momentum equilibrium level.
• Bullish Retest:
The price pulls back toward the mean from above and holds.
• Bearish Retest:
The price rallies back toward the mean from below and rejects.
Successful retests suggest the current momentum regime remains intact and may continue in the prevailing direction.

⚪Bollinger Breakouts
The standard Bollinger Bands identify strong momentum expansions.
• Bullish Breakout:
The oscillator line closes above the upper band.
• Bearish Breakout:
The oscillator line closes below the lower band.
These conditions suggest momentum is becoming unusually strong. Bullish breakouts above the upper band may indicate overbought conditions, while bearish breakouts below the lower band may indicate oversold conditions.

⚪Expanded Bollinger Extremes
The expanded Bollinger Bands represent statistically extreme momentum conditions.
• Bullish Extreme:
The oscillator line exceeds the expanded upper band.
• Bearish Extreme:
The oscillator line exceeds the expanded lower band.
These events occur less frequently and often identify powerful directional moves or temporary exhaustion phases.

⚪Momentum Context
The indicator should not be viewed as a simple overbought or oversold tool.
Instead, it measures how far momentum has deviated from its dynamic equilibrium while continuously adapting to current volatility conditions.
The interaction between the oscillator, mean, and adaptive bands provides a framework for identifying:
• Trend continuation
• Momentum expansion
• Momentum exhaustion
• Volatility shifts
• Regime transitions
The result is a price-integrated momentum model that provides both trend context and extreme-condition analysis within a single overlay.
█ Related Scripts
Dynamic Price Oscillator (Zeiierman)
█ Settings
-----------------
Disclaimer
The content provided in my scripts, indicators, ideas, algorithms, and systems is for educational and informational purposes only. It does not constitute financial advice, investment recommendations, or a solicitation to buy or sell any financial instruments. I will not accept liability for any loss or damage, including without limitation any loss of profit, which may arise directly or indirectly from the use of or reliance on such information.
All investments involve risk, and the past performance of a security, industry, sector, market, financial product, trading strategy, backtest, or individual's trading does not guarantee future results or returns. Investors are fully responsible for any investment decisions they make. Such decisions should be based solely on an evaluation of their financial circumstances, investment objectives, risk tolerance, and liquidity needs.
Dynamic Price Oscillator Overlay (Zeiierman) is a volatility-adjusted momentum overlay that transforms oscillator behavior directly onto the price chart.
Instead of displaying momentum in a separate pane, the indicator wraps a dynamic oscillator around an adaptive price anchor, allowing traders to visualize momentum expansion, contraction, and directional bias directly within price action.
The calculation combines long-term price displacement with volatility-adjusted movement and then applies Bollinger Band analysis to identify statistically stretched market conditions.
The result is a dynamic price-following structure that highlights momentum extremes, trend transitions, and overextended conditions while remaining visually integrated with the chart.
█ How It Works
⚪ Volatility-Adjusted Price Engine
The indicator begins by measuring market volatility using True Range.
This creates a dynamic volatility component that adapts to changing market conditions.
⚪ Dual Momentum Calculation
The oscillator combines two independent measurements:
• Long-term price displacement
• Volatility-adjusted price movement
These components are blended together and smoothed.
The result is a momentum engine that reacts to both directional movement and changing volatility.
⚪ Dynamic Oscillator Bands
The oscillator is surrounded by two Bollinger Band structures.
Standard bands identify elevated momentum conditions while expanded bands identify extreme momentum conditions.
These bands create adaptive thresholds that expand and contract as market behavior changes.
⚪ Dynamic Mean
The indicator calculates a central equilibrium level using the midpoint of the expanded Bollinger Bands.
This serves as the oscillator's primary trend reference.
⚪ Price Overlay Projection
Rather than plotting the oscillator separately, the indicator wraps the oscillator around a moving price anchor.
The oscillator is projected directly onto the chart:
This creates a momentum structure that follows price while preserving oscillator behavior.
█ How to Use
⚪ Dynamic Price Oscillator Overlay
• When the oscillator line remains above the Dynamic Mean, momentum conditions are generally bullish.
• When the oscillator line remains below the Dynamic Mean, momentum conditions are generally bearish.
⚪Mean Crosses
The Dynamic Mean acts as the primary trend reference.
• Bullish Cross:
The oscillator line crosses above the mean.
• Bearish Cross:
The oscillator line crosses below the mean.
These signals often represent transitions between bullish and bearish momentum regimes.
⚪Mean Retests
The Dynamic Mean acts as the primary momentum equilibrium level.
• Bullish Retest:
The price pulls back toward the mean from above and holds.
• Bearish Retest:
The price rallies back toward the mean from below and rejects.
Successful retests suggest the current momentum regime remains intact and may continue in the prevailing direction.
⚪Bollinger Breakouts
The standard Bollinger Bands identify strong momentum expansions.
• Bullish Breakout:
The oscillator line closes above the upper band.
• Bearish Breakout:
The oscillator line closes below the lower band.
These conditions suggest momentum is becoming unusually strong. Bullish breakouts above the upper band may indicate overbought conditions, while bearish breakouts below the lower band may indicate oversold conditions.
⚪Expanded Bollinger Extremes
The expanded Bollinger Bands represent statistically extreme momentum conditions.
• Bullish Extreme:
The oscillator line exceeds the expanded upper band.
• Bearish Extreme:
The oscillator line exceeds the expanded lower band.
These events occur less frequently and often identify powerful directional moves or temporary exhaustion phases.
⚪Momentum Context
The indicator should not be viewed as a simple overbought or oversold tool.
Instead, it measures how far momentum has deviated from its dynamic equilibrium while continuously adapting to current volatility conditions.
The interaction between the oscillator, mean, and adaptive bands provides a framework for identifying:
• Trend continuation
• Momentum expansion
• Momentum exhaustion
• Volatility shifts
• Regime transitions
The result is a price-integrated momentum model that provides both trend context and extreme-condition analysis within a single overlay.
█ Related Scripts
Dynamic Price Oscillator (Zeiierman)
█ Settings
- Length: Controls the primary lookback period used throughout the oscillator calculations and Bollinger Band framework.
- Smoothing Factor: Controls the responsiveness of the oscillator. Higher values produce smoother movement while lower values increase sensitivity.
- Price Anchor Length: Determines the EMA length used to anchor the overlay structure to price.
-----------------
Disclaimer
The content provided in my scripts, indicators, ideas, algorithms, and systems is for educational and informational purposes only. It does not constitute financial advice, investment recommendations, or a solicitation to buy or sell any financial instruments. I will not accept liability for any loss or damage, including without limitation any loss of profit, which may arise directly or indirectly from the use of or reliance on such information.
All investments involve risk, and the past performance of a security, industry, sector, market, financial product, trading strategy, backtest, or individual's trading does not guarantee future results or returns. Investors are fully responsible for any investment decisions they make. Such decisions should be based solely on an evaluation of their financial circumstances, investment objectives, risk tolerance, and liquidity needs.
오픈 소스 스크립트
트레이딩뷰의 진정한 정신에 따라, 이 스크립트의 작성자는 이를 오픈소스로 공개하여 트레이더들이 기능을 검토하고 검증할 수 있도록 했습니다. 작성자에게 찬사를 보냅니다! 이 코드는 무료로 사용할 수 있지만, 코드를 재게시하는 경우 하우스 룰이 적용된다는 점을 기억하세요.

Access my indicators at: zeiierman.com
Join Our Free Discord: discord.gg/zeiiermantrading
Join Our Free Discord: discord.gg/zeiiermantrading
면책사항
해당 정보와 게시물은 금융, 투자, 트레이딩 또는 기타 유형의 조언이나 권장 사항으로 간주되지 않으며, 트레이딩뷰에서 제공하거나 보증하는 것이 아닙니다. 자세한 내용은 이용 약관을 참조하세요.
오픈 소스 스크립트
트레이딩뷰의 진정한 정신에 따라, 이 스크립트의 작성자는 이를 오픈소스로 공개하여 트레이더들이 기능을 검토하고 검증할 수 있도록 했습니다. 작성자에게 찬사를 보냅니다! 이 코드는 무료로 사용할 수 있지만, 코드를 재게시하는 경우 하우스 룰이 적용된다는 점을 기억하세요.
Access my indicators at: zeiierman.com
Join Our Free Discord: discord.gg/zeiiermantrading
Join Our Free Discord: discord.gg/zeiiermantrading
면책사항
해당 정보와 게시물은 금융, 투자, 트레이딩 또는 기타 유형의 조언이나 권장 사항으로 간주되지 않으며, 트레이딩뷰에서 제공하거나 보증하는 것이 아닙니다. 자세한 내용은 이용 약관을 참조하세요.