OPEN-SOURCE SCRIPT
Institutional Price Action
Overview & Functionality
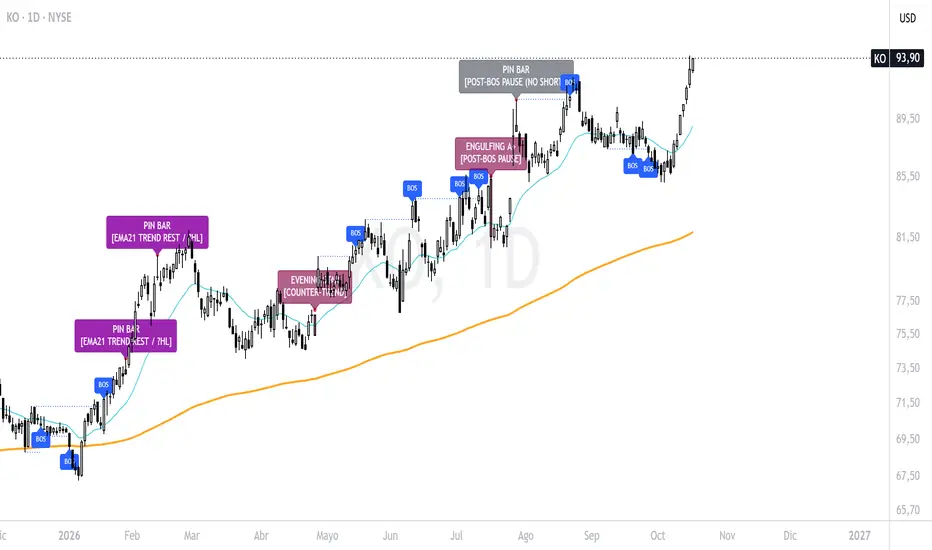
Traditional candlestick indicators treat every pattern equally, generating high false-positive rates when a textbook candle forms in the wrong market structure context. Institutional Price Action Master v2.1 solves this by combining three multi-bar Price Action engines with real-time Market Structure (BOS / CHoCH) and Dynamic Value Zones (EMA 21 & EMA 200) on Bar 0 (zero-lag execution).
The script simultaneously scans for 3 speeds of institutional reversals:
Instead of plotting raw patterns blindly, the Contextual Classifier evaluates where the pattern originates, where it closes relative to the EMAs, and whether a structural breakout (BOS) just occurred:
Settings & Configuration
Traditional candlestick indicators treat every pattern equally, generating high false-positive rates when a textbook candle forms in the wrong market structure context. Institutional Price Action Master v2.1 solves this by combining three multi-bar Price Action engines with real-time Market Structure (BOS / CHoCH) and Dynamic Value Zones (EMA 21 & EMA 200) on Bar 0 (zero-lag execution).
The script simultaneously scans for 3 speeds of institutional reversals:
- Bar Reversals (Pin Bars / Kangaroo Tails): Captures intrabar liquidity sweeps and algorithmic defense of dynamic levels (>60% rejection wick, <15% opposing nose, ATR-filtered range).
- Bar Reversals (Engulfing Bars): Detects aggressive market-order displacement and body expansion (>0.6 ATR body, high close strength, volume expansion).
- Bar Reversals (Morning & Evening Stars): Identifies 3-stage institutional accumulation/distribution cycles (Impulse Bar $\rightarrow$ Compressed Star Bar $\rightarrow$ Confirmation Bar penetrating >50% of Bar 1).
Instead of plotting raw patterns blindly, the Contextual Classifier evaluates where the pattern originates, where it closes relative to the EMAs, and whether a structural breakout (BOS) just occurred:
- 🟢 / 🔴 [EMA VALUE ZONE] (Grade-A Trend Continuation): The pattern aligns with the Macro EMA (200) and its extreme touches/kisses the Tactical EMA (21) or Macro EMA (200), capturing the birth of a structural Higher Low (HL) or Lower High (LH) in real time.
- 🟣 [EMA SHAKEOUT / ?HL] & [EMA21 TREND REST / ?HL] (Absorption Alert): In strong bull markets, single-bar bearish engulfing candles that crash directly into the rising EMA 21—or appear after 12+ consecutive bars of "EMA 21 surfing"—rarely initiate bear markets. They act as institutional shakeouts, marking the exact floor (HL) of the pullback.
- ⬜ [POST-BOS PAUSE (NO SHORT)] (Breakout Protection): Filters out bearish Pin Bars or Engulfings that appear within N bars of a fresh bullish Break of Structure (BOS), preventing premature counter-trend entries during active breakouts.
- 🟠 [EXHAUSTION / PULLBACK] (Mean Reversion): Signals forming in "thin air" (>2.0 ATR away from EMA 21) without a fresh BOS, warning of stretched elasticity and an impending return to the mean.
Settings & Configuration
- Engine Activation & Display:
- Chart Label Language: Switch on-chart labels between English and Español.
- Enable Engulfing / Pin Bar / Morning & Evening Star: Toggle any of the 3 pattern engines independently.
- Show Real-Time BOS / CHoCH: Displays dotted horizontal structural break lines on Bar 0 without relying on delayed pivot labels.
- Hide Weak / Post-BOS Pause Signals: Cleans the chart by hiding low-probability counter-trend or breakout-pause labels.
- Real-Time Market Structure (BOS & Momentum):
- Structural Pivot Length (PH/PL): Lookback/lookforward bars (default: 5) to anchor structural highs and lows.
- Post-BOS Momentum Window: Number of bars (default: 4) after a confirmed BOS during which opposing signals are downgraded to Post-BOS Pause.
- EMA 21 'Trend Surfing' Bars: Consecutive closes (default: 12) above/below EMA 21 required to activate the Trend Rest / Shakeout filter.
- Value Zones & Elasticity (EMAs):
- Fast EMA (21) & Macro EMA (200): Dynamic equilibrium references.
- EMA Value Zone Tolerance (ATR): Maximum ATR distance (default: 0.5 ATR) to consider a pattern as touching/testing the EMA.
- Overextension Threshold (ATR): Minimum ATR stretch from EMA 21 (default: 2.0 ATR) to trigger Exhaustion warnings.
- Candle Anatomy & 4. Global Confluences:
- Full control over minimum ATR body/range sizes, wick-to-body ratios, volume multipliers (vs. 20 SMA), liquidity sweeps, and strict gap mode for equities.
Utility & How to Use It- Trend-Following Entries (High Probability): Wait for Green ([EMA VALUE ZONE]) labels in an uptrend (Price > EMA 200) or Red ([EMA VALUE ZONE]) labels in a downtrend. The script automatically plots red circles at the exact structural invalidation level (Stop Loss) of the 1-bar, 2-bar, or 3-bar formation.
- Avoiding Bull/Bear Traps (Risk Management): When a Purple ([EMA SHAKEOUT / ?HL]) or Gray ([POST-BOS PAUSE]) label appears during an uptrend, do not short. Use it to hold existing long positions or prepare to buy the dip once the next candle holds above the shakeout low.
- Profit Taking & Tactical Pullbacks: Use Orange ([EXHAUSTION / PULLBACK]) labels to scale out of long positions or tighten trailing stops when price is overextended far above the 21 EMA.
[list/]
오픈 소스 스크립트
트레이딩뷰의 진정한 정신에 따라, 이 스크립트의 작성자는 이를 오픈소스로 공개하여 트레이더들이 기능을 검토하고 검증할 수 있도록 했습니다. 작성자에게 찬사를 보냅니다! 이 코드는 무료로 사용할 수 있지만, 코드를 재게시하는 경우 하우스 룰이 적용된다는 점을 기억하세요.

면책사항
해당 정보와 게시물은 금융, 투자, 트레이딩 또는 기타 유형의 조언이나 권장 사항으로 간주되지 않으며, 트레이딩뷰에서 제공하거나 보증하는 것이 아닙니다. 자세한 내용은 이용 약관을 참조하세요.
오픈 소스 스크립트
트레이딩뷰의 진정한 정신에 따라, 이 스크립트의 작성자는 이를 오픈소스로 공개하여 트레이더들이 기능을 검토하고 검증할 수 있도록 했습니다. 작성자에게 찬사를 보냅니다! 이 코드는 무료로 사용할 수 있지만, 코드를 재게시하는 경우 하우스 룰이 적용된다는 점을 기억하세요.
면책사항
해당 정보와 게시물은 금융, 투자, 트레이딩 또는 기타 유형의 조언이나 권장 사항으로 간주되지 않으며, 트레이딩뷰에서 제공하거나 보증하는 것이 아닙니다. 자세한 내용은 이용 약관을 참조하세요.