OPEN-SOURCE SCRIPT
Multi-Timeframe Trend Table
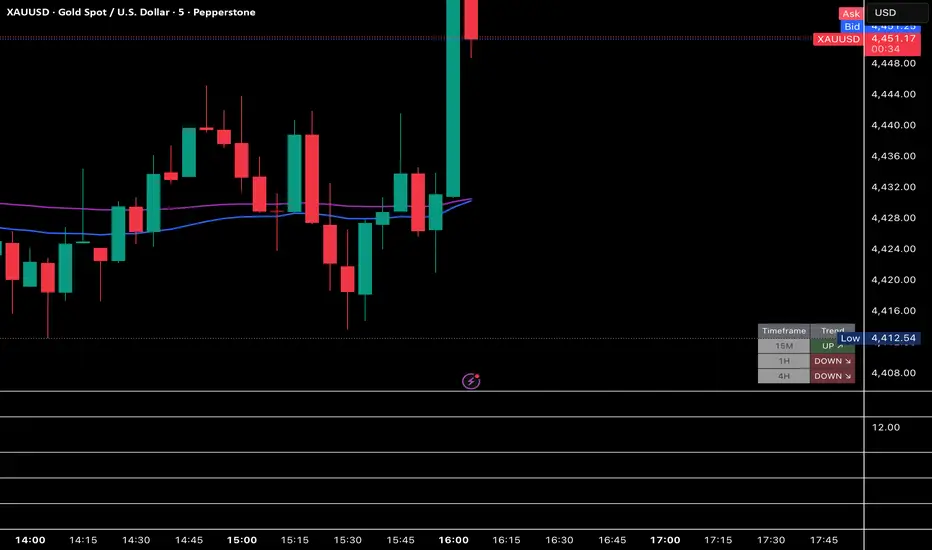
📊 Indicator Overview:
This is a Multi-Timeframe Trend Analyzer based on:
Short EMA (fast trend)
Long EMA (slow trend)
Across 3 customizable timeframes
It summarizes market direction into a simple table + chart overlay, so you instantly know the market bias.
🧠 Core Logic
The trend is defined using a very clear rule:
📌 Bullish (UP ↗)
Price > Short EMA
Price > Long EMA
📌 Bearish (DOWN ↘)
Price < Short EMA
Price < Long EMA
👉 So you’re basically measuring:
Is price above both momentum layers? → strong bullish
Below both? → strong bearish
⏱️ Multi-Timeframe Analysis
You can choose any 3 timeframes, for example:
15M (entry timing)
1H (intraday trend)
4H (macro bias)
Each timeframe is analyzed independently and displayed in the table.
📋 Trend Table
The indicator draws a table on your chart showing:
🔹 If EMA values are enabled:
| Timeframe | Trend | EMA Short | EMA Long |
🔹 If disabled:
| Timeframe | Trend |
🎯 Signal Meaning
🟢 UP ↗
Price is above both EMAs
Strong bullish bias
🔴 DOWN ↘
Price is below both EMAs
Strong bearish bias
📈 Current Timeframe EMAs
The indicator also plots on your chart:
Short EMA
Long EMA
⚙️ You can enable/disable this from inputs.
👉 This gives you visual confirmation directly on price.
⚙️ Inputs & Customization
🔹 Timeframes
1st TF
2nd TF
3rd TF
(fully customizable)
🔹 EMA Settings
Short EMA length
Long EMA length
🔹 Display Options
Show/hide EMA values in table
Show/hide EMAs on chart
Table position
💡 Practical Trading Use
1️⃣ Trend Filtering (Bias Tool)
All 3 TFs = UP → strong bullish environment
All 3 TFs = DOWN → strong bearish environment
👉 Use it to define market bias before entering
2️⃣ Entry Timing
Example:
4H → UP
1H → UP
15M → Pullback
👉 Look for buy entries on lower timeframe
3️⃣ Avoid Bad Trades
Example:
4H → UP
1H → DOWN
👉 Market is conflicting → stay out
⚠️ Important Notes
- This is not a standalone entry system
- It’s a trend/bias confirmation tool
- EMAs are lagging → signals are slightly delayed
🧩 Final Summary
This indicator simplifies a complex question:
“Is the market aligned across multiple timeframes?”
This is a Multi-Timeframe Trend Analyzer based on:
Short EMA (fast trend)
Long EMA (slow trend)
Across 3 customizable timeframes
It summarizes market direction into a simple table + chart overlay, so you instantly know the market bias.
🧠 Core Logic
The trend is defined using a very clear rule:
📌 Bullish (UP ↗)
Price > Short EMA
Price > Long EMA
📌 Bearish (DOWN ↘)
Price < Short EMA
Price < Long EMA
👉 So you’re basically measuring:
Is price above both momentum layers? → strong bullish
Below both? → strong bearish
⏱️ Multi-Timeframe Analysis
You can choose any 3 timeframes, for example:
15M (entry timing)
1H (intraday trend)
4H (macro bias)
Each timeframe is analyzed independently and displayed in the table.
📋 Trend Table
The indicator draws a table on your chart showing:
🔹 If EMA values are enabled:
| Timeframe | Trend | EMA Short | EMA Long |
🔹 If disabled:
| Timeframe | Trend |
🎯 Signal Meaning
🟢 UP ↗
Price is above both EMAs
Strong bullish bias
🔴 DOWN ↘
Price is below both EMAs
Strong bearish bias
📈 Current Timeframe EMAs
The indicator also plots on your chart:
Short EMA
Long EMA
⚙️ You can enable/disable this from inputs.
👉 This gives you visual confirmation directly on price.
⚙️ Inputs & Customization
🔹 Timeframes
1st TF
2nd TF
3rd TF
(fully customizable)
🔹 EMA Settings
Short EMA length
Long EMA length
🔹 Display Options
Show/hide EMA values in table
Show/hide EMAs on chart
Table position
💡 Practical Trading Use
1️⃣ Trend Filtering (Bias Tool)
All 3 TFs = UP → strong bullish environment
All 3 TFs = DOWN → strong bearish environment
👉 Use it to define market bias before entering
2️⃣ Entry Timing
Example:
4H → UP
1H → UP
15M → Pullback
👉 Look for buy entries on lower timeframe
3️⃣ Avoid Bad Trades
Example:
4H → UP
1H → DOWN
👉 Market is conflicting → stay out
⚠️ Important Notes
- This is not a standalone entry system
- It’s a trend/bias confirmation tool
- EMAs are lagging → signals are slightly delayed
🧩 Final Summary
This indicator simplifies a complex question:
“Is the market aligned across multiple timeframes?”
오픈 소스 스크립트
트레이딩뷰의 진정한 정신에 따라, 이 스크립트의 작성자는 이를 오픈소스로 공개하여 트레이더들이 기능을 검토하고 검증할 수 있도록 했습니다. 작성자에게 찬사를 보냅니다! 이 코드는 무료로 사용할 수 있지만, 코드를 재게시하는 경우 하우스 룰이 적용된다는 점을 기억하세요.

면책사항
해당 정보와 게시물은 금융, 투자, 트레이딩 또는 기타 유형의 조언이나 권장 사항으로 간주되지 않으며, 트레이딩뷰에서 제공하거나 보증하는 것이 아닙니다. 자세한 내용은 이용 약관을 참조하세요.
오픈 소스 스크립트
트레이딩뷰의 진정한 정신에 따라, 이 스크립트의 작성자는 이를 오픈소스로 공개하여 트레이더들이 기능을 검토하고 검증할 수 있도록 했습니다. 작성자에게 찬사를 보냅니다! 이 코드는 무료로 사용할 수 있지만, 코드를 재게시하는 경우 하우스 룰이 적용된다는 점을 기억하세요.
면책사항
해당 정보와 게시물은 금융, 투자, 트레이딩 또는 기타 유형의 조언이나 권장 사항으로 간주되지 않으며, 트레이딩뷰에서 제공하거나 보증하는 것이 아닙니다. 자세한 내용은 이용 약관을 참조하세요.