OPEN-SOURCE SCRIPT
Candle Body Momentum [UkutaLabs]
█ OVERVIEW
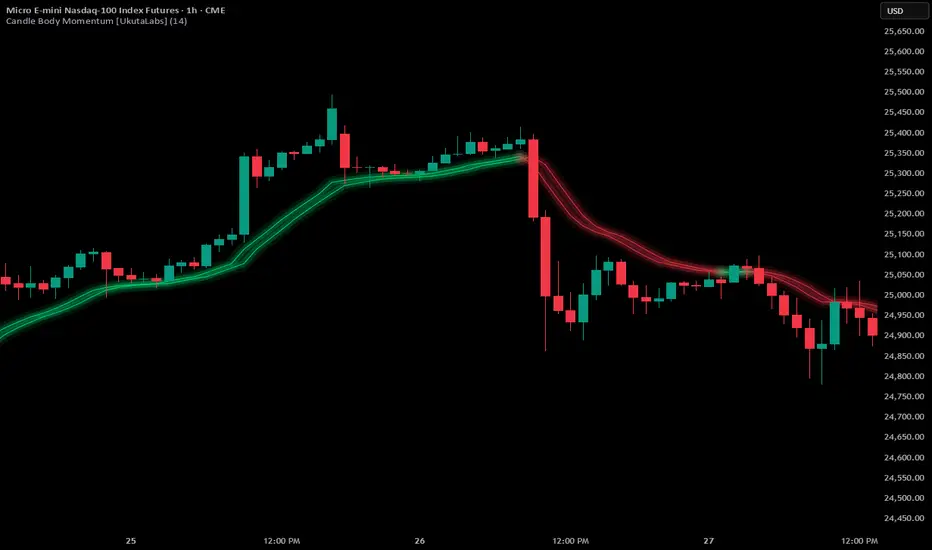
Candle Body Momentum is a price-action driven indicator that measures directional strength by comparing an Exponential Moving Average (EMA) of the closing price against an EMA of the opening price.
Instead of relying on traditional momentum formulas, this tool focuses purely on the candle body — the space between open and close — to reveal which side of the market is in control.
When the EMA of the close is above the EMA of the open, buyers are demonstrating sustained pressure.
When the EMA of the close is below the EMA of the open, sellers are in control.
This simple comparison creates a clean and intuitive view of real directional momentum.
█ HOW IT WORKS
• Calculates an EMA of the closing price
• Calculates an EMA of the opening price
• Compares the two values to determine directional bias
• Displays the relationship visually for quick interpretation
Because candle bodies represent commitment (not just volatility), this method filters out much of the noise created by wicks and intrabar spikes.
█ HOW TO USE
Trend Confirmation
Use Candle Body Momentum to confirm directional bias. If price is trending and the close EMA remains above the open EMA, the trend is supported by sustained buying pressure.
Momentum Shifts
Crossovers between the two EMAs can signal potential shifts in control before traditional moving average systems react.
Pullback Validation
During retracements, watch whether body momentum flips temporarily or remains aligned with the broader trend.
Market Conditions
• Strong separation = strong momentum
• Compression = weakening momentum
• Frequent crossovers = ranging conditions
█ WHY IT’S DIFFERENT
Traditional momentum indicators use mathematical derivatives of price.
Candle Body Momentum focuses on something simpler and often more meaningful:
Who is consistently closing stronger than they opened?
This gives traders a clean, price-driven perspective on directional strength without unnecessary complexity.
Candle Body Momentum is a price-action driven indicator that measures directional strength by comparing an Exponential Moving Average (EMA) of the closing price against an EMA of the opening price.
Instead of relying on traditional momentum formulas, this tool focuses purely on the candle body — the space between open and close — to reveal which side of the market is in control.
When the EMA of the close is above the EMA of the open, buyers are demonstrating sustained pressure.
When the EMA of the close is below the EMA of the open, sellers are in control.
This simple comparison creates a clean and intuitive view of real directional momentum.
█ HOW IT WORKS
• Calculates an EMA of the closing price
• Calculates an EMA of the opening price
• Compares the two values to determine directional bias
• Displays the relationship visually for quick interpretation
Because candle bodies represent commitment (not just volatility), this method filters out much of the noise created by wicks and intrabar spikes.
█ HOW TO USE
Trend Confirmation
Use Candle Body Momentum to confirm directional bias. If price is trending and the close EMA remains above the open EMA, the trend is supported by sustained buying pressure.
Momentum Shifts
Crossovers between the two EMAs can signal potential shifts in control before traditional moving average systems react.
Pullback Validation
During retracements, watch whether body momentum flips temporarily or remains aligned with the broader trend.
Market Conditions
• Strong separation = strong momentum
• Compression = weakening momentum
• Frequent crossovers = ranging conditions
█ WHY IT’S DIFFERENT
Traditional momentum indicators use mathematical derivatives of price.
Candle Body Momentum focuses on something simpler and often more meaningful:
Who is consistently closing stronger than they opened?
This gives traders a clean, price-driven perspective on directional strength without unnecessary complexity.
오픈 소스 스크립트
트레이딩뷰의 진정한 정신에 따라, 이 스크립트의 작성자는 이를 오픈소스로 공개하여 트레이더들이 기능을 검토하고 검증할 수 있도록 했습니다. 작성자에게 찬사를 보냅니다! 이 코드는 무료로 사용할 수 있지만, 코드를 재게시하는 경우 하우스 룰이 적용된다는 점을 기억하세요.

면책사항
해당 정보와 게시물은 금융, 투자, 트레이딩 또는 기타 유형의 조언이나 권장 사항으로 간주되지 않으며, 트레이딩뷰에서 제공하거나 보증하는 것이 아닙니다. 자세한 내용은 이용 약관을 참조하세요.
오픈 소스 스크립트
트레이딩뷰의 진정한 정신에 따라, 이 스크립트의 작성자는 이를 오픈소스로 공개하여 트레이더들이 기능을 검토하고 검증할 수 있도록 했습니다. 작성자에게 찬사를 보냅니다! 이 코드는 무료로 사용할 수 있지만, 코드를 재게시하는 경우 하우스 룰이 적용된다는 점을 기억하세요.
면책사항
해당 정보와 게시물은 금융, 투자, 트레이딩 또는 기타 유형의 조언이나 권장 사항으로 간주되지 않으며, 트레이딩뷰에서 제공하거나 보증하는 것이 아닙니다. 자세한 내용은 이용 약관을 참조하세요.