OPEN-SOURCE SCRIPT
QuantumPips Adaptive Fib Bands
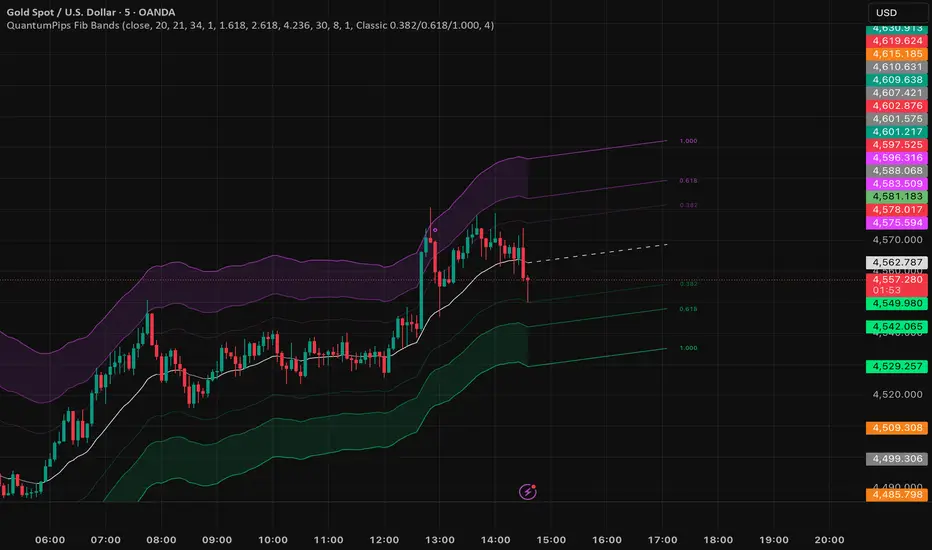
QuantumPips Adaptive Fib Bands is a volatility “map” that wraps price in dynamic bands.
Instead of using fixed distances, the bands expand and contract with the market using ATR (volatility). This helps you quickly see when the price is acting normal, stretched, or extreme.
What you’re looking at
1) The middle line (Basis)
The Basis is a smoothed average price (EMA).
Think of it as the market’s “fair value” line for the current timeframe.
When price is around the Basis, the market is usually balanced.
When price pulls away from the Basis, the market is stretching.
2) The bands (Top/Bottom levels)
Above and below the Basis you’ll see three levels.
Band 1 = normal volatility move
Band 2 = stretched move
Band 3 = extreme move
The distances are based on a smoothed ATR, then scaled by the multipliers (your ratios).
3) The right side Fib numbers
On the right, the labels mark the projected band levels so you can read them quickly.
You can show either:
classic “Fib-style” labels (0.382 / 0.618 / 1.000), or
your exact ratio values (1.618 / 2.618 / 4.236)
4) Projection lines (optional)
If Projection is enabled, the script draws the bands forward by a set number of bars.
This is not a prediction, it simply extends the current slope of the Basis forward so you can visualize where the envelope would sit if conditions stay similar.
5) Sweep hints (optional)
Sweep hints appear when the price pushes beyond the outer band and then shows immediate hesitation/pressure back inside.
It’s meant as a “pay attention here” marker, not a trade signal by itself.
How traders use it:
A) Trend + pullback context
Use the Basis as the trend reference:
In an uptrend, pullbacks into the lower bands often act as “discount areas.”
In a downtrend, pushes into the upper bands often act as “premium areas.”
You still wait for your own confirmation (rejection candle, structure shift, session level, etc.).
B) Overextension spotting
When price reaches Band 3, it’s an “extreme stretch” versus current volatility.
That’s useful because:
Continuation can still happen, but reversals and sharp pullbacks become more likely, especially around session highs/lows
C) Range / chop conditions
If price keeps crossing the Basis and bouncing between Band 1 areas, the market is often ranging.
In that case:
Band 2–3 acts more like “range edges,”
and the Basis is often the mid-range magnet.
D) Target planning (clean visuals)
Bands can be used as natural reference points for:
take-profit zones,
“where price is likely to slow down,”
and mapping where the next volatility expansion might reach.
오픈 소스 스크립트
트레이딩뷰의 진정한 정신에 따라, 이 스크립트의 작성자는 이를 오픈소스로 공개하여 트레이더들이 기능을 검토하고 검증할 수 있도록 했습니다. 작성자에게 찬사를 보냅니다! 이 코드는 무료로 사용할 수 있지만, 코드를 재게시하는 경우 하우스 룰이 적용된다는 점을 기억하세요.

QuantumPips — Trade Structure. Not Noise.
Market Structure Pro (Invite-only): quantumpips.io/msp
Educational only. Not financial advice.
Market Structure Pro (Invite-only): quantumpips.io/msp
Educational only. Not financial advice.
면책사항
해당 정보와 게시물은 금융, 투자, 트레이딩 또는 기타 유형의 조언이나 권장 사항으로 간주되지 않으며, 트레이딩뷰에서 제공하거나 보증하는 것이 아닙니다. 자세한 내용은 이용 약관을 참조하세요.
오픈 소스 스크립트
트레이딩뷰의 진정한 정신에 따라, 이 스크립트의 작성자는 이를 오픈소스로 공개하여 트레이더들이 기능을 검토하고 검증할 수 있도록 했습니다. 작성자에게 찬사를 보냅니다! 이 코드는 무료로 사용할 수 있지만, 코드를 재게시하는 경우 하우스 룰이 적용된다는 점을 기억하세요.
QuantumPips — Trade Structure. Not Noise.
Market Structure Pro (Invite-only): quantumpips.io/msp
Educational only. Not financial advice.
Market Structure Pro (Invite-only): quantumpips.io/msp
Educational only. Not financial advice.
면책사항
해당 정보와 게시물은 금융, 투자, 트레이딩 또는 기타 유형의 조언이나 권장 사항으로 간주되지 않으며, 트레이딩뷰에서 제공하거나 보증하는 것이 아닙니다. 자세한 내용은 이용 약관을 참조하세요.