업데이트됨
ATR Move Multiple (X Days)
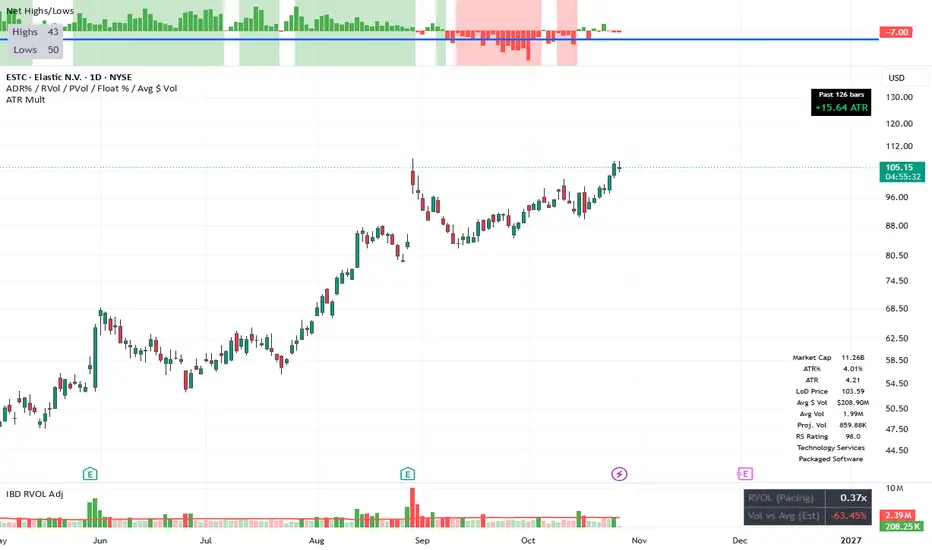
This indicator shows how far a stock (or any ticker) has moved over a chosen number of bars, measured in units of its own average true range (ATR).
It takes the price change from X bars ago to the current bar, divides that change by the ATR (which you can set to any length, default 100), and displays the result as a simple number. A reading of +2.5 means the price is up 2.5 ATRs over that lookback period; –1.8 means it is down 1.8 ATRs.
The number appears in a small table on the chart. You can adjust the lookback length, the ATR period, and the table’s appearance (size, colors, position, border) directly in the indicator settings.
It takes the price change from X bars ago to the current bar, divides that change by the ATR (which you can set to any length, default 100), and displays the result as a simple number. A reading of +2.5 means the price is up 2.5 ATRs over that lookback period; –1.8 means it is down 1.8 ATRs.
The number appears in a small table on the chart. You can adjust the lookback length, the ATR period, and the table’s appearance (size, colors, position, border) directly in the indicator settings.
릴리즈 노트
Added a space above the table so that it wouldn't be blocked by TradingView's built in arrows when hovering your mouse on the chart. 
면책사항
해당 정보와 게시물은 금융, 투자, 트레이딩 또는 기타 유형의 조언이나 권장 사항으로 간주되지 않으며, 트레이딩뷰에서 제공하거나 보증하는 것이 아닙니다. 자세한 내용은 이용 약관을 참조하세요.
면책사항
해당 정보와 게시물은 금융, 투자, 트레이딩 또는 기타 유형의 조언이나 권장 사항으로 간주되지 않으며, 트레이딩뷰에서 제공하거나 보증하는 것이 아닙니다. 자세한 내용은 이용 약관을 참조하세요.