업데이트됨
Recent Order Blocks
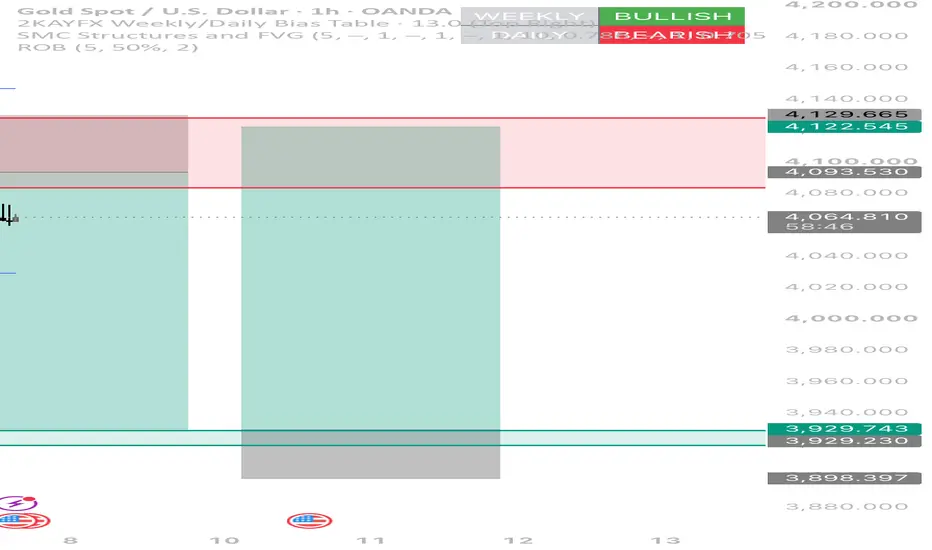
A clean, clutter-free order block indicator that shows only what matters: the single most recent unmitigated Buy OB and Sell OB on any chart and timeframe.
How it works
A Buy OB forms when price closes above the last swing high (break of structure). The indicator marks the last bearish candle at the origin of that move, which is the zone price rejected from before the impulse.
A Sell OB forms when price closes below the last swing low. It marks the last bullish candle at the origin of the drop.
Each zone is drawn as two horizontal lines (the candle’s high and low) extended to the right, with optional shading.
Once price returns to the zone, the OB is considered mitigated and removed. The indicator then automatically shows the next most recent unmitigated OB, so your chart always stays focused on live levels.
Settings
Swing strength: controls the size of structure breaks. Lower values give more frequent, smaller OBs; higher values give major ones only.
Mitigation mode: Touch, 50%, or Closes through.
Replace with newer OB: always show the newest OB, or hold the current one until it’s mitigated.
Colours, line width, zone shading and labels.
Alerts
New Buy OB, New Sell OB, Buy OB mitigated, Sell OB mitigated.
Tip: Use it together with higher-timeframe structure. Look for buy OBs in uptrends and sell OBs in downtrends, and wait for lower-timeframe confirmation inside the zone.
This indicator is a tool for analysis, not a signal service. Always manage your risk.
How it works
A Buy OB forms when price closes above the last swing high (break of structure). The indicator marks the last bearish candle at the origin of that move, which is the zone price rejected from before the impulse.
A Sell OB forms when price closes below the last swing low. It marks the last bullish candle at the origin of the drop.
Each zone is drawn as two horizontal lines (the candle’s high and low) extended to the right, with optional shading.
Once price returns to the zone, the OB is considered mitigated and removed. The indicator then automatically shows the next most recent unmitigated OB, so your chart always stays focused on live levels.
Settings
Swing strength: controls the size of structure breaks. Lower values give more frequent, smaller OBs; higher values give major ones only.
Mitigation mode: Touch, 50%, or Closes through.
Replace with newer OB: always show the newest OB, or hold the current one until it’s mitigated.
Colours, line width, zone shading and labels.
Alerts
New Buy OB, New Sell OB, Buy OB mitigated, Sell OB mitigated.
Tip: Use it together with higher-timeframe structure. Look for buy OBs in uptrends and sell OBs in downtrends, and wait for lower-timeframe confirmation inside the zone.
This indicator is a tool for analysis, not a signal service. Always manage your risk.
릴리즈 노트
Made changes for accurate mapping of the order blocks
면책사항
해당 정보와 게시물은 금융, 투자, 트레이딩 또는 기타 유형의 조언이나 권장 사항으로 간주되지 않으며, 트레이딩뷰에서 제공하거나 보증하는 것이 아닙니다. 자세한 내용은 이용 약관을 참조하세요.
면책사항
해당 정보와 게시물은 금융, 투자, 트레이딩 또는 기타 유형의 조언이나 권장 사항으로 간주되지 않으며, 트레이딩뷰에서 제공하거나 보증하는 것이 아닙니다. 자세한 내용은 이용 약관을 참조하세요.