Trend Speed - Patrick Signals v1
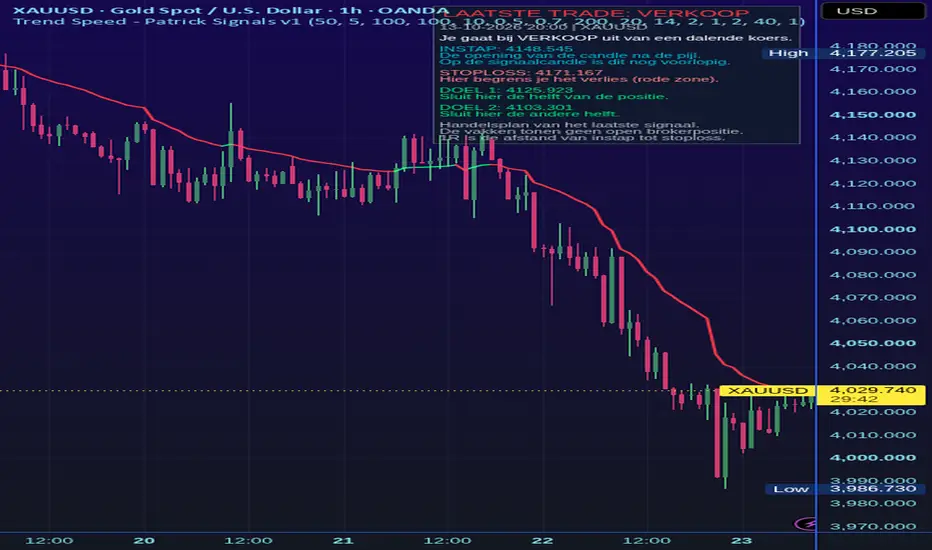
Trend Speed - Patrick Signals v1 adds a confirmed setup and visual trade-plan layer to the open-source Trend Speed Analyzer by Zeiierman. It makes momentum information and ATR-based levels easier to read, with a Dutch explanation panel for beginners.
CREDITS AND ADDED FUNCTIONALITY
The adaptive moving average and cumulative trend-speed engine are derived from Zeiierman's Trend Speed Analyzer. Credit: Zeiierman. Original publication:
The confirmation approach follows the demonstration by AlgoTradePro in its video about testing the Trend Speed Analyzer. Added functionality includes one confirmed setup per regime, configurable confirmation filters, next-bar-open entry references, managed risk/reward drawings, two partial target levels, alerts, and a plain-language Dutch explanation of the latest setup. This derivative remains open source under CC BY-NC-SA 4.0.
SIGNAL LOGIC
The original adaptive trend line determines the directional regime. After a regime flip, a setup must satisfy the enabled filters within an inclusive window of 0 to 10 bars. Defaults require directional and accelerating HMA-smoothed trend speed, a current wave of at least 0.5 times the historical same-direction average, and normalized histogram color at least 0.7 for buys or at most 0.3 for sells. Dominance is optional and off by default. EMA200, EMA slope and ADX14/14 filters are optional and off by default.
TRADE PLAN
A green BUY arrow marks a confirmed long setup; a red SELL arrow marks a confirmed short setup. Arrows appear only after bar close. On the signal bar the entry reference is provisional. The following bar's open replaces it with the reference entry; this is a reference, not an actual broker fill. Stop distance is 2 times ATR14, rounded up to a tick. Target 1 is 1R for closing half; target 2 is 2R for closing the remainder. Red shading shows the entry-to-stop region; green shading shows target regions. Levels freeze from the setup and do not trail price. The latest plan is shown by default; earlier arrows remain visible. Drawings are anchored to bar index and price.
ENGLISH TRANSLATION OF DUTCH UI
Toon instap, SL en TP = show entry, stop and targets. Lengte plan (candles) = drawing length in bars. Bewaar laatste plannen = number of retained plans. Toon dynamische trendlijn = show adaptive trend line. Nederlandse uitleg laatste trade = Dutch explanation of latest setup. KOOP = buy; VERKOOP = sell; INSTAP = entry; STOPLOSS = loss-limiting stop; DOEL 1 / DOEL 2 = target 1 / target 2; helft sluiten = close half; rest sluiten = close remainder; voorlopig = provisional. BUY bevestigd / SELL bevestigd = confirmed buy / sell.
USAGE AND LIMITATIONS
Use regular candles. Create alerts from BUY bevestigd or SELL bevestigd, preferably once per bar close. The indicator draws setups; it does not submit orders, track broker positions or confirm whether a target filled. It can show another setup while a separate strategy still holds a position. Loaded chart history influences wave averages: load sufficient earlier data before comparing signals. The forming bar can move the trend line, while arrows require a confirmed bar. No higher-timeframe requests or lookahead are used. This indicator makes no performance claim and is not a backtest.
NEDERLANDS
De pijl is het bevestigde signaal. De blauwe lijn is de instapreferentie, de rode lijn begrenst het verlies en de groene lijnen zijn twee winstdoelen. Bij doel 1 sluit je de helft; bij doel 2 de rest. Het uitlegblok rechts gaat over het laatste signaal en is geen melding dat er een echte positie openstaat. Pas op de volgende candleopening ligt de instapreferentie vast.
CREDITS AND ADDED FUNCTIONALITY
The adaptive moving average and cumulative trend-speed engine are derived from Zeiierman's Trend Speed Analyzer. Credit: Zeiierman. Original publication:
The confirmation approach follows the demonstration by AlgoTradePro in its video about testing the Trend Speed Analyzer. Added functionality includes one confirmed setup per regime, configurable confirmation filters, next-bar-open entry references, managed risk/reward drawings, two partial target levels, alerts, and a plain-language Dutch explanation of the latest setup. This derivative remains open source under CC BY-NC-SA 4.0.
SIGNAL LOGIC
The original adaptive trend line determines the directional regime. After a regime flip, a setup must satisfy the enabled filters within an inclusive window of 0 to 10 bars. Defaults require directional and accelerating HMA-smoothed trend speed, a current wave of at least 0.5 times the historical same-direction average, and normalized histogram color at least 0.7 for buys or at most 0.3 for sells. Dominance is optional and off by default. EMA200, EMA slope and ADX14/14 filters are optional and off by default.
TRADE PLAN
A green BUY arrow marks a confirmed long setup; a red SELL arrow marks a confirmed short setup. Arrows appear only after bar close. On the signal bar the entry reference is provisional. The following bar's open replaces it with the reference entry; this is a reference, not an actual broker fill. Stop distance is 2 times ATR14, rounded up to a tick. Target 1 is 1R for closing half; target 2 is 2R for closing the remainder. Red shading shows the entry-to-stop region; green shading shows target regions. Levels freeze from the setup and do not trail price. The latest plan is shown by default; earlier arrows remain visible. Drawings are anchored to bar index and price.
ENGLISH TRANSLATION OF DUTCH UI
Toon instap, SL en TP = show entry, stop and targets. Lengte plan (candles) = drawing length in bars. Bewaar laatste plannen = number of retained plans. Toon dynamische trendlijn = show adaptive trend line. Nederlandse uitleg laatste trade = Dutch explanation of latest setup. KOOP = buy; VERKOOP = sell; INSTAP = entry; STOPLOSS = loss-limiting stop; DOEL 1 / DOEL 2 = target 1 / target 2; helft sluiten = close half; rest sluiten = close remainder; voorlopig = provisional. BUY bevestigd / SELL bevestigd = confirmed buy / sell.
USAGE AND LIMITATIONS
Use regular candles. Create alerts from BUY bevestigd or SELL bevestigd, preferably once per bar close. The indicator draws setups; it does not submit orders, track broker positions or confirm whether a target filled. It can show another setup while a separate strategy still holds a position. Loaded chart history influences wave averages: load sufficient earlier data before comparing signals. The forming bar can move the trend line, while arrows require a confirmed bar. No higher-timeframe requests or lookahead are used. This indicator makes no performance claim and is not a backtest.
NEDERLANDS
De pijl is het bevestigde signaal. De blauwe lijn is de instapreferentie, de rode lijn begrenst het verlies en de groene lijnen zijn twee winstdoelen. Bij doel 1 sluit je de helft; bij doel 2 de rest. Het uitlegblok rechts gaat over het laatste signaal en is geen melding dat er een echte positie openstaat. Pas op de volgende candleopening ligt de instapreferentie vast.

면책사항
해당 정보와 게시물은 금융, 투자, 트레이딩 또는 기타 유형의 조언이나 권장 사항으로 간주되지 않으며, 트레이딩뷰에서 제공하거나 보증하는 것이 아닙니다. 자세한 내용은 이용 약관을 참조하세요.
면책사항
해당 정보와 게시물은 금융, 투자, 트레이딩 또는 기타 유형의 조언이나 권장 사항으로 간주되지 않으며, 트레이딩뷰에서 제공하거나 보증하는 것이 아닙니다. 자세한 내용은 이용 약관을 참조하세요.