MTF Candle Status Dashboard: Real-Time Volume & Momentum
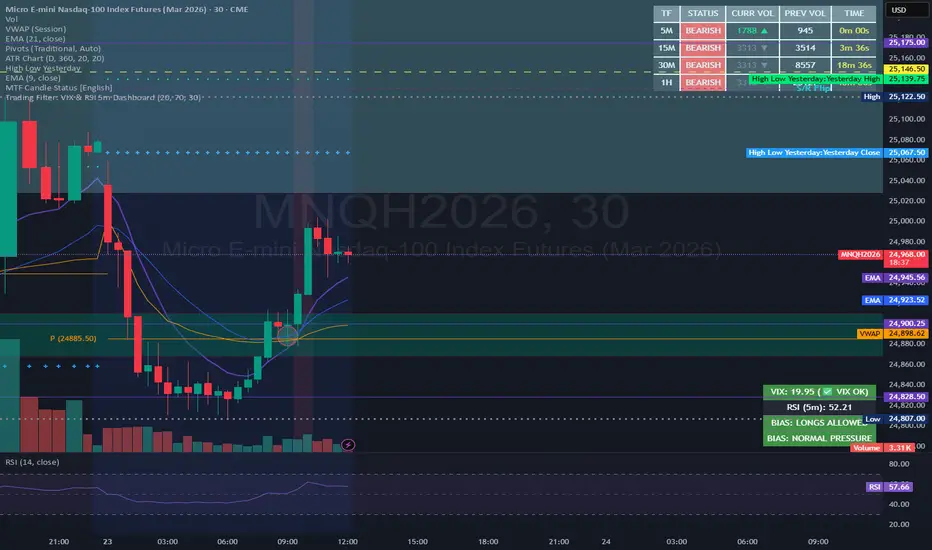
Description
This high-contrast dashboard provides a comprehensive view of market momentum across multiple timeframes (5m, 15m, 30m, and 1h) directly on your main chart. It is specifically designed for day traders who need to monitor price sentiment and volume breakouts simultaneously without switching tabs.
Key Features:
Multi-Timeframe Analysis: Real-time monitoring of the 5-minute, 15-minute, 30-minute, and 1-hour candles.
Live Sentiment Tracking: Instantly see if the current price action is Bullish or Bearish across all periods.
Smart Volume Breakout Indicator: Compares the Current Volume of the live candle against the Previous Candle's Volume.
▲ (Lime Green): Current volume has already exceeded the previous candle's total volume (High Momentum).
▼ (Gray): Current volume is still lower than the previous candle.
Integrated Countdown Timer: A precision timer for each timeframe showing exactly how much time remains before the current candle closes.
High-Contrast UI: Optimized for both dark and light themes with a black background and bold colors to ensure readability over complex indicators or price action.
How to use it:
Confluence: Look for moments where all timeframes turn the same color (e.g., all Green). This indicates strong trend alignment.
Volume Confirmation: When you see a BULLISH status combined with the ▲ symbol in the Volume column, it confirms a high-conviction move supported by increasing market participation.
Timing: Use the TIME column to prepare for entries just before a candle closes or to avoid "fakes" during low-volume periods.
This high-contrast dashboard provides a comprehensive view of market momentum across multiple timeframes (5m, 15m, 30m, and 1h) directly on your main chart. It is specifically designed for day traders who need to monitor price sentiment and volume breakouts simultaneously without switching tabs.
Key Features:
Multi-Timeframe Analysis: Real-time monitoring of the 5-minute, 15-minute, 30-minute, and 1-hour candles.
Live Sentiment Tracking: Instantly see if the current price action is Bullish or Bearish across all periods.
Smart Volume Breakout Indicator: Compares the Current Volume of the live candle against the Previous Candle's Volume.
▲ (Lime Green): Current volume has already exceeded the previous candle's total volume (High Momentum).
▼ (Gray): Current volume is still lower than the previous candle.
Integrated Countdown Timer: A precision timer for each timeframe showing exactly how much time remains before the current candle closes.
High-Contrast UI: Optimized for both dark and light themes with a black background and bold colors to ensure readability over complex indicators or price action.
How to use it:
Confluence: Look for moments where all timeframes turn the same color (e.g., all Green). This indicates strong trend alignment.
Volume Confirmation: When you see a BULLISH status combined with the ▲ symbol in the Volume column, it confirms a high-conviction move supported by increasing market participation.
Timing: Use the TIME column to prepare for entries just before a candle closes or to avoid "fakes" during low-volume periods.

면책사항
해당 정보와 게시물은 금융, 투자, 트레이딩 또는 기타 유형의 조언이나 권장 사항으로 간주되지 않으며, 트레이딩뷰에서 제공하거나 보증하는 것이 아닙니다. 자세한 내용은 이용 약관을 참조하세요.
면책사항
해당 정보와 게시물은 금융, 투자, 트레이딩 또는 기타 유형의 조언이나 권장 사항으로 간주되지 않으며, 트레이딩뷰에서 제공하거나 보증하는 것이 아닙니다. 자세한 내용은 이용 약관을 참조하세요.