Reversal Z-Score Bands (Black-Chart)
Reversal Z-Score Bands (Black-Chart)
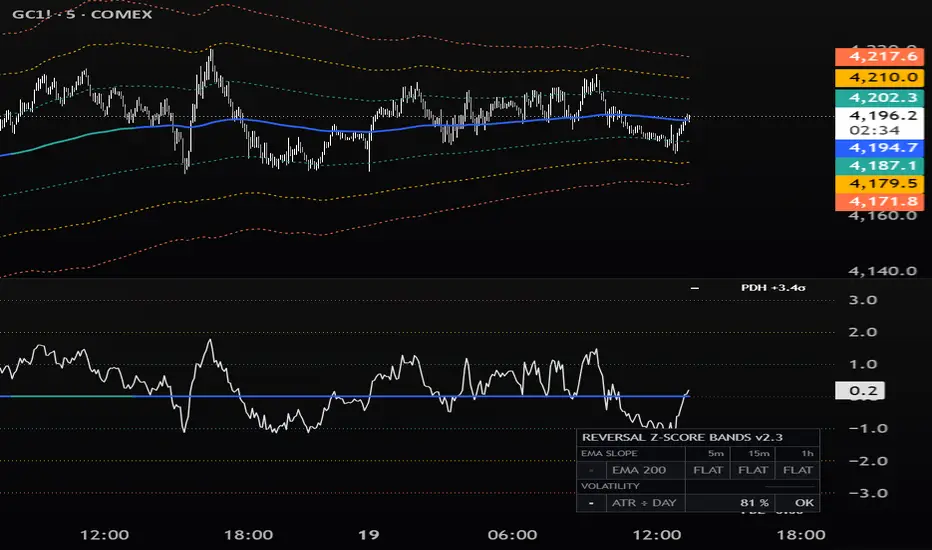
The Reversal Z-Score Bands indicator measures how far price has stretched from a long EMA, in units of standard deviation (σ), and marks the moment price turns back toward it. Distance is shown in a separate pane as a z-score: the zero line is the EMA and the horizontal lines are the deviation bands.
As a mean-reversion tool, its reversal signals mark the bar where price, after an excursion beyond the bands, comes back inside them toward the EMA. A z-score can return inside a band for two different reasons: price moves back, or the band widens toward price while price stays extended. The indicator separates the two, so that a real return of price is not confused with a band that simply caught up. The signals describe what price has just done; they do not predict that the trend will change.
Note: the default settings (Length 200, signal level 2σ) are a starting point. Explore the settings to adapt the indicator to your market and timeframe.
🔶 USAGE

The indicator works on three layers: the z-score pane with its bands, the re-entry signals built on the First-Touch Level, and the context elements (volume, volatility, previous-day levels and dashboard).
🔹 Z-Score Pane and Bands
The pane shows z = (Source − EMA) ÷ σ, as a line or as candles (open, high, low and close converted to σ, wicks included). Up to five bands can be enabled; bands 1–3 (1σ, 2σ, 3σ) are on by default.
The EMA, drawn as the pane's zero line, is coloured by its slope: rising, falling, or neutral when it is flat. The slope is measured in σ over a window proportional to Length, so its meaning stays the same when Length changes.
With "Also on Price Chart" the EMA, the bands and the volatility background are drawn on the main chart too.
🔹 First-Touch Level and Reversal Signals

When a close first goes beyond ±kσ (Signal Level k, default 2), the price of the ±kσ band on that bar is frozen: the First-Touch Level. On the price chart it is a fixed horizontal line; in the pane it is the same price re-expressed in the current σ.
- Price re-entry, coloured triangle: the close comes back inside the First-Touch Level. Price itself has turned back toward the mean.
- Band re-entry, grey triangle: the z-score is back inside ±kσ, but the close is still beyond the First-Touch Level. The band came back, not price.
The level ends when the close comes back inside it or reaches the EMA. With "Only with Flat EMA" the signals are shown only while the EMA is flat, which keeps them to markets moving around a stable mean.
🔹 Extreme Volume and Volatility Background

A diamond marks bars whose high (or low) reaches beyond ±kσ with abnormal volume. Volume is converted into a z-score against its own mean, with the same weighting and Length as the EMA.
While the close is beyond ±kσ the background is shaded: Expansion when the short ATR is well above the ATR over the EMA Length (bars are widening), Stable otherwise. It shows whether an excursion happens with expanding or ordinary ranges.
🔹 Previous-Day Levels and Dashboard

The previous day's high and low (PDH, PDL) are shown with their current distance from the EMA in σ, as short segments and labels to the right of the last bar. Previous week and month levels can be switched on in the settings.
The dashboard shows the slope of the EMA on three timeframes (▲ BULL, ▼ BEAR or FLAT) and the volatility regime: ATR(14) against its 24-hour average. With the dashboard EMA set to the same Length, the first column matches the EMA colour in the pane and the other two show the same EMA on higher timeframes.
🔶 DETAILS
- Deviation, Exponential method (default): variance = EMA(source²) − EMA(source)². The deviation uses the same weights as the EMA, the way VWAP weights by volume, so the EMA and the bands react at the same speed.
- Deviation, Fixed window method: root-mean-square distance from the EMA over the last N bars, all weighted equally (N = Length).
- Exponential cap: with the Exponential method, price cannot move further than √((N−1)/2) σ from the EMA: about 3σ with Length 20, 10σ with 200, 22σ with 999. Bands beyond that value can never be reached by a close. The same cap applies to the volume z-score.
- Repainting: higher-timeframe values in the dashboard come from the last closed bar of that timeframe, and previous-period levels use completed periods only. Triangles, diamonds and the background are based on the current bar: on the live bar they can appear or disappear until it closes. On historical bars they do not change.
- Warm-up: the EMA, σ and the long ATR need roughly Length bars of history to settle. The volatility row shows "NEEDS n BARS" until 24 hours of bars are available.
- The volume diamonds need volume data and do not appear on symbols without volume.
- Dashboard timeframes lower than the chart timeframe are not calculated and show "BELOW TF". Day, week and month follow the symbol's session.
🔶 ALERTS
When an alert is created, the following conditions are available:
- Re-entry below +kσ / Re-entry above −kσ: the z-score crosses back inside ±kσ. This covers both price and band re-entries and respects "Only with Flat EMA".
- Abnormal volume beyond +kσ / Abnormal volume beyond −kσ: same condition as the diamonds.
Use "Once Per Bar Close" to be alerted on confirmed bars only.
🔶 SETTINGS
🔹 EMA & Deviation
- Length: length of the EMA and of the deviation (default 200).
- Source: price used for the EMA and the z-score (default close).
- Deviation Method: Exponential (EMA weights) or Fixed window (last N bars).
- Show EMA: colour, width and style of the EMA.
- Also on Price Chart: draws the EMA, the enabled bands and the background on the main chart as well.
🔹 EMA Slope
- Color EMA by Slope: colours the EMA Rising or Falling when it is not flat.
- Window (× Length): window over which the slope is measured, as a fraction of Length (default 0.25).
- Flat Threshold (σ): below this movement in σ the EMA is considered flat (default 0.5).
🔹 Bands
- Band 1 to Band 5: on/off, distance in σ, fill in the pane, colours above and below the EMA, width and style.
- Fill Transparency: transparency of the band fills.
🔹 Oscillator Pane
- Pane View: Line (z-score of the Source) or Candles (OHLC in σ).
- Show Z-score: colour and width of the line, colours of up and down candles.
🔹 Signals
- Signal Level k (σ): level used by the reversal triangles, the volume diamonds and the volatility background (default 2).
- Re-entry Triangles: colours for From Above and From Below.
- Band Re-entry: shows the grey triangle when the band, not price, comes back.
- Only with Flat EMA: shows the reversal signals only while the EMA is flat.
- Extreme Volume Diamonds: on/off, Volume Threshold (z) (default 3) and colours.
🔹 Volatility Background
- Show Background: on/off.
- Short ATR (bars): length of the short ATR (default 14).
- Expansion Threshold (×): short ATR ÷ long ATR above which the background shows Expansion (default 1.5).
🔹 First Touch Level
- In Pane / On Price Chart: where the level is drawn; colour, width and style.
🔹 Liquidity Levels
- In Pane / On Price Chart: where the levels are drawn.
- Day / Week / Month: switches each period on or off (only Day by default), with its colour.
🔹 Dashboard
- Show Dashboard, Position and Dashboard Size.
- EMA Row: slope of the dashboard EMA on the three timeframes.
- Timeframe 1, 2, 3: columns of the dashboard (default: chart, 15m, 1h). Choose timeframes equal to or higher than the chart.
- Dashboard EMA Length: EMA used by the dashboard (default 200).
- ATR ÷ Day Mean: volatility row, with the Min value below which it shows LOW.
This is an analysis tool. It does not give buy or sell recommendations and makes no claim about future results. Use it together with your own analysis and risk management.
________
Reversal Z-Score Bands (Black-Chart)
L'indicatore Reversal Z-Score Bands misura quanto il prezzo si è allungato rispetto a una EMA lunga, in deviazioni standard (σ), e segna il momento in cui torna verso di essa. La distanza è mostrata in un pannello separato come z-score: la linea dello zero è la EMA e le linee orizzontali sono le bande di deviazione.
Come strumento di ritorno alla media, i suoi segnali di inversione segnano la candela in cui il prezzo, dopo un'escursione oltre le bande, rientra verso la EMA. Uno z-score può rientrare in una banda per due motivi diversi: il prezzo torna indietro, oppure la banda si allarga verso il prezzo mentre il prezzo resta esteso. L'indicatore separa i due casi, così un vero ritorno del prezzo non si confonde con una banda che lo ha semplicemente raggiunto. I segnali descrivono ciò che il prezzo ha appena fatto; non prevedono che il trend cambierà.
Nota: le impostazioni di default (Length 200, livello del segnale 2σ) sono un punto di partenza. Esplora le impostazioni per adattare l'indicatore al tuo mercato e al tuo timeframe.
🔶 UTILIZZO
L'indicatore lavora su tre livelli: il pannello dello z-score con le bande, i segnali di rientro costruiti sul First-Touch Level, e gli elementi di contesto (volume, volatilità, livelli del giorno precedente e dashboard).
🔹 Pannello z-score e bande
Il pannello mostra z = (Source − EMA) ÷ σ, come linea o come candele (apertura, massimo, minimo e chiusura convertiti in σ, stoppini compresi). Si possono accendere fino a cinque bande; le bande 1–3 (1σ, 2σ, 3σ) sono accese di default.
La EMA, disegnata come linea dello zero del pannello, è colorata in base alla pendenza: in salita, in discesa, oppure neutra quando è piatta. La pendenza si misura in σ su una finestra proporzionale a Length, quindi il suo significato resta lo stesso quando Length cambia.
Con "Also on Price Chart" la EMA, le bande e lo sfondo di volatilità si disegnano anche sul grafico principale.
🔹 First-Touch Level e segnali di inversione
Alla prima chiusura oltre ±kσ (Signal Level k, default 2) il prezzo della banda ±kσ su quella candela viene fissato: è il First-Touch Level. Sul grafico dei prezzi è una linea orizzontale ferma; nel pannello è lo stesso prezzo espresso nella σ attuale.
- Rientro del prezzo, triangolo colorato: la chiusura torna dentro il First-Touch Level. È il prezzo stesso a tornare verso la media.
- Rientro della banda, triangolo grigio: lo z-score è tornato dentro ±kσ, ma la chiusura è ancora oltre il First-Touch Level. È rientrata la banda, non il prezzo.
Il livello termina quando la chiusura torna dentro di esso o raggiunge la EMA. Con "Only with Flat EMA" i segnali compaiono solo quando la EMA è piatta, così restano limitati ai mercati che si muovono attorno a una media stabile.
🔹 Volume estremo e sfondo di volatilità
Un rombo segna le candele il cui massimo (o minimo) arriva oltre ±kσ con volume anomalo. Il volume è convertito in z-score rispetto alla sua media, con la stessa ponderazione e la stessa Length della EMA.
Mentre la chiusura è oltre ±kσ lo sfondo si colora: Expansion quando l'ATR corto è molto sopra l'ATR sulla Length della EMA (le candele si stanno allargando), Stable altrimenti. Indica se un'escursione avviene con candele in espansione o di ampiezza normale.
🔹 Livelli del giorno precedente e dashboard
Massimo e minimo del giorno precedente (PDH, PDL) sono mostrati con la loro distanza attuale dalla EMA in σ, come brevi segmenti ed etichette a destra dell'ultima candela. I livelli della settimana e del mese precedenti si accendono dalle impostazioni.
La dashboard mostra la pendenza della EMA su tre timeframe (▲ BULL, ▼ BEAR o FLAT) e il regime di volatilità: ATR(14) rispetto alla sua media delle 24 ore. Con la EMA della dashboard impostata alla stessa Length, la prima colonna coincide con il colore della EMA nel pannello e le altre due mostrano la stessa EMA sui timeframe superiori.
🔶 DETTAGLI
- Deviazione, metodo Exponential (default): varianza = EMA(source²) − EMA(source)². La deviazione usa gli stessi pesi della EMA, come la VWAP pesa per volume, così EMA e bande reagiscono alla stessa velocità.
- Deviazione, metodo Fixed window: distanza quadratica media dalla EMA sulle ultime N barre, tutte con lo stesso peso (N = Length).
- Limite esponenziale: con il metodo Exponential il prezzo non può allontanarsi dalla EMA più di √((N−1)/2) σ: circa 3σ con Length 20, 10σ con 200, 22σ con 999. Le bande oltre quel valore non possono mai essere raggiunte da una chiusura. Lo stesso limite vale per lo z-score del volume.
- Ridisegno: i valori dei timeframe superiori nella dashboard provengono dall'ultima candela chiusa di quel timeframe, e i livelli dei periodi precedenti usano solo periodi conclusi. Triangoli, rombi e sfondo si basano sulla candela corrente: sulla candela in corso possono comparire o sparire finché non chiude. Sulle candele storiche non cambiano.
- Riscaldamento: EMA, σ e ATR lungo hanno bisogno di circa Length barre di storico per assestarsi. La riga della volatilità mostra "NEEDS n BARS" finché non sono disponibili 24 ore di candele.
- I rombi di volume richiedono i dati di volume e non compaiono sui simboli senza volume.
- I timeframe della dashboard più bassi del timeframe del grafico non vengono calcolati e mostrano "BELOW TF". Giorno, settimana e mese seguono la sessione del simbolo.
🔶 ALERT
Quando si crea un alert sono disponibili queste condizioni:
- Re-entry below +kσ / Re-entry above −kσ: lo z-score rientra dentro ±kσ. Comprende sia i rientri del prezzo sia quelli della banda e rispetta "Only with Flat EMA".
- Abnormal volume beyond +kσ / Abnormal volume beyond −kσ: stessa condizione dei rombi.
Usa "Once Per Bar Close" per ricevere l'alert solo sulle candele confermate.
🔶 IMPOSTAZIONI
🔹 EMA & Deviation
- Length: lunghezza della EMA e della deviazione (default 200).
- Source: prezzo usato per la EMA e lo z-score (default close).
- Deviation Method: Exponential (pesi della EMA) o Fixed window (ultime N barre).
- Show EMA: colore, spessore e stile della EMA.
- Also on Price Chart: disegna la EMA, le bande accese e lo sfondo anche sul grafico principale.
🔹 EMA Slope
- Color EMA by Slope: colora la EMA Rising o Falling quando non è piatta.
- Window (× Length): finestra su cui si misura la pendenza, come frazione di Length (default 0,25).
- Flat Threshold (σ): sotto questo movimento in σ la EMA è considerata piatta (default 0,5).
🔹 Bands
- Da Band 1 a Band 5: acceso/spento, distanza in σ, riempimento nel pannello, colori sopra e sotto la EMA, spessore e stile.
- Fill Transparency: trasparenza dei riempimenti delle bande.
🔹 Oscillator Pane
- Pane View: Line (z-score della Source) o Candles (OHLC in σ).
- Show Z-score: colore e spessore della linea, colori delle candele rialziste e ribassiste.
🔹 Signals
- Signal Level k (σ): livello usato dai triangoli di inversione, dai rombi di volume e dallo sfondo di volatilità (default 2).
- Re-entry Triangles: colori per From Above e From Below.
- Band Re-entry: mostra il triangolo grigio quando a rientrare è la banda, non il prezzo.
- Only with Flat EMA: mostra i segnali di inversione solo quando la EMA è piatta.
- Extreme Volume Diamonds: acceso/spento, Volume Threshold (z) (default 3) e colori.
🔹 Volatility Background
- Show Background: acceso/spento.
- Short ATR (bars): lunghezza dell'ATR corto (default 14).
- Expansion Threshold (×): ATR corto ÷ ATR lungo sopra il quale lo sfondo indica Expansion (default 1,5).
🔹 First Touch Level
- In Pane / On Price Chart: dove si disegna il livello; colore, spessore e stile.
🔹 Liquidity Levels
- In Pane / On Price Chart: dove si disegnano i livelli.
- Day / Week / Month: accende o spegne ogni periodo (di default solo Day), con il suo colore.
🔹 Dashboard
- Show Dashboard, Position e Dashboard Size.
- EMA Row: pendenza della EMA della dashboard sui tre timeframe.
- Timeframe 1, 2, 3: colonne della dashboard (default: grafico, 15m, 1h). Scegli timeframe uguali o superiori a quello del grafico.
- Dashboard EMA Length: EMA usata dalla dashboard (default 200).
- ATR ÷ Day Mean: riga della volatilità, con il valore Min sotto il quale mostra LOW.
Questo è uno strumento di analisi. Non fornisce raccomandazioni di acquisto o vendita e non promette risultati futuri. Usalo insieme alla tua analisi e alla tua gestione del rischio.
The Reversal Z-Score Bands indicator measures how far price has stretched from a long EMA, in units of standard deviation (σ), and marks the moment price turns back toward it. Distance is shown in a separate pane as a z-score: the zero line is the EMA and the horizontal lines are the deviation bands.
As a mean-reversion tool, its reversal signals mark the bar where price, after an excursion beyond the bands, comes back inside them toward the EMA. A z-score can return inside a band for two different reasons: price moves back, or the band widens toward price while price stays extended. The indicator separates the two, so that a real return of price is not confused with a band that simply caught up. The signals describe what price has just done; they do not predict that the trend will change.
Note: the default settings (Length 200, signal level 2σ) are a starting point. Explore the settings to adapt the indicator to your market and timeframe.
🔶 USAGE
The indicator works on three layers: the z-score pane with its bands, the re-entry signals built on the First-Touch Level, and the context elements (volume, volatility, previous-day levels and dashboard).
🔹 Z-Score Pane and Bands
The pane shows z = (Source − EMA) ÷ σ, as a line or as candles (open, high, low and close converted to σ, wicks included). Up to five bands can be enabled; bands 1–3 (1σ, 2σ, 3σ) are on by default.
The EMA, drawn as the pane's zero line, is coloured by its slope: rising, falling, or neutral when it is flat. The slope is measured in σ over a window proportional to Length, so its meaning stays the same when Length changes.
With "Also on Price Chart" the EMA, the bands and the volatility background are drawn on the main chart too.
🔹 First-Touch Level and Reversal Signals
When a close first goes beyond ±kσ (Signal Level k, default 2), the price of the ±kσ band on that bar is frozen: the First-Touch Level. On the price chart it is a fixed horizontal line; in the pane it is the same price re-expressed in the current σ.
- Price re-entry, coloured triangle: the close comes back inside the First-Touch Level. Price itself has turned back toward the mean.
- Band re-entry, grey triangle: the z-score is back inside ±kσ, but the close is still beyond the First-Touch Level. The band came back, not price.
The level ends when the close comes back inside it or reaches the EMA. With "Only with Flat EMA" the signals are shown only while the EMA is flat, which keeps them to markets moving around a stable mean.
🔹 Extreme Volume and Volatility Background
A diamond marks bars whose high (or low) reaches beyond ±kσ with abnormal volume. Volume is converted into a z-score against its own mean, with the same weighting and Length as the EMA.
While the close is beyond ±kσ the background is shaded: Expansion when the short ATR is well above the ATR over the EMA Length (bars are widening), Stable otherwise. It shows whether an excursion happens with expanding or ordinary ranges.
🔹 Previous-Day Levels and Dashboard
The previous day's high and low (PDH, PDL) are shown with their current distance from the EMA in σ, as short segments and labels to the right of the last bar. Previous week and month levels can be switched on in the settings.
The dashboard shows the slope of the EMA on three timeframes (▲ BULL, ▼ BEAR or FLAT) and the volatility regime: ATR(14) against its 24-hour average. With the dashboard EMA set to the same Length, the first column matches the EMA colour in the pane and the other two show the same EMA on higher timeframes.
🔶 DETAILS
- Deviation, Exponential method (default): variance = EMA(source²) − EMA(source)². The deviation uses the same weights as the EMA, the way VWAP weights by volume, so the EMA and the bands react at the same speed.
- Deviation, Fixed window method: root-mean-square distance from the EMA over the last N bars, all weighted equally (N = Length).
- Exponential cap: with the Exponential method, price cannot move further than √((N−1)/2) σ from the EMA: about 3σ with Length 20, 10σ with 200, 22σ with 999. Bands beyond that value can never be reached by a close. The same cap applies to the volume z-score.
- Repainting: higher-timeframe values in the dashboard come from the last closed bar of that timeframe, and previous-period levels use completed periods only. Triangles, diamonds and the background are based on the current bar: on the live bar they can appear or disappear until it closes. On historical bars they do not change.
- Warm-up: the EMA, σ and the long ATR need roughly Length bars of history to settle. The volatility row shows "NEEDS n BARS" until 24 hours of bars are available.
- The volume diamonds need volume data and do not appear on symbols without volume.
- Dashboard timeframes lower than the chart timeframe are not calculated and show "BELOW TF". Day, week and month follow the symbol's session.
🔶 ALERTS
When an alert is created, the following conditions are available:
- Re-entry below +kσ / Re-entry above −kσ: the z-score crosses back inside ±kσ. This covers both price and band re-entries and respects "Only with Flat EMA".
- Abnormal volume beyond +kσ / Abnormal volume beyond −kσ: same condition as the diamonds.
Use "Once Per Bar Close" to be alerted on confirmed bars only.
🔶 SETTINGS
🔹 EMA & Deviation
- Length: length of the EMA and of the deviation (default 200).
- Source: price used for the EMA and the z-score (default close).
- Deviation Method: Exponential (EMA weights) or Fixed window (last N bars).
- Show EMA: colour, width and style of the EMA.
- Also on Price Chart: draws the EMA, the enabled bands and the background on the main chart as well.
🔹 EMA Slope
- Color EMA by Slope: colours the EMA Rising or Falling when it is not flat.
- Window (× Length): window over which the slope is measured, as a fraction of Length (default 0.25).
- Flat Threshold (σ): below this movement in σ the EMA is considered flat (default 0.5).
🔹 Bands
- Band 1 to Band 5: on/off, distance in σ, fill in the pane, colours above and below the EMA, width and style.
- Fill Transparency: transparency of the band fills.
🔹 Oscillator Pane
- Pane View: Line (z-score of the Source) or Candles (OHLC in σ).
- Show Z-score: colour and width of the line, colours of up and down candles.
🔹 Signals
- Signal Level k (σ): level used by the reversal triangles, the volume diamonds and the volatility background (default 2).
- Re-entry Triangles: colours for From Above and From Below.
- Band Re-entry: shows the grey triangle when the band, not price, comes back.
- Only with Flat EMA: shows the reversal signals only while the EMA is flat.
- Extreme Volume Diamonds: on/off, Volume Threshold (z) (default 3) and colours.
🔹 Volatility Background
- Show Background: on/off.
- Short ATR (bars): length of the short ATR (default 14).
- Expansion Threshold (×): short ATR ÷ long ATR above which the background shows Expansion (default 1.5).
🔹 First Touch Level
- In Pane / On Price Chart: where the level is drawn; colour, width and style.
🔹 Liquidity Levels
- In Pane / On Price Chart: where the levels are drawn.
- Day / Week / Month: switches each period on or off (only Day by default), with its colour.
🔹 Dashboard
- Show Dashboard, Position and Dashboard Size.
- EMA Row: slope of the dashboard EMA on the three timeframes.
- Timeframe 1, 2, 3: columns of the dashboard (default: chart, 15m, 1h). Choose timeframes equal to or higher than the chart.
- Dashboard EMA Length: EMA used by the dashboard (default 200).
- ATR ÷ Day Mean: volatility row, with the Min value below which it shows LOW.
This is an analysis tool. It does not give buy or sell recommendations and makes no claim about future results. Use it together with your own analysis and risk management.
________
Reversal Z-Score Bands (Black-Chart)
L'indicatore Reversal Z-Score Bands misura quanto il prezzo si è allungato rispetto a una EMA lunga, in deviazioni standard (σ), e segna il momento in cui torna verso di essa. La distanza è mostrata in un pannello separato come z-score: la linea dello zero è la EMA e le linee orizzontali sono le bande di deviazione.
Come strumento di ritorno alla media, i suoi segnali di inversione segnano la candela in cui il prezzo, dopo un'escursione oltre le bande, rientra verso la EMA. Uno z-score può rientrare in una banda per due motivi diversi: il prezzo torna indietro, oppure la banda si allarga verso il prezzo mentre il prezzo resta esteso. L'indicatore separa i due casi, così un vero ritorno del prezzo non si confonde con una banda che lo ha semplicemente raggiunto. I segnali descrivono ciò che il prezzo ha appena fatto; non prevedono che il trend cambierà.
Nota: le impostazioni di default (Length 200, livello del segnale 2σ) sono un punto di partenza. Esplora le impostazioni per adattare l'indicatore al tuo mercato e al tuo timeframe.
🔶 UTILIZZO
L'indicatore lavora su tre livelli: il pannello dello z-score con le bande, i segnali di rientro costruiti sul First-Touch Level, e gli elementi di contesto (volume, volatilità, livelli del giorno precedente e dashboard).
🔹 Pannello z-score e bande
Il pannello mostra z = (Source − EMA) ÷ σ, come linea o come candele (apertura, massimo, minimo e chiusura convertiti in σ, stoppini compresi). Si possono accendere fino a cinque bande; le bande 1–3 (1σ, 2σ, 3σ) sono accese di default.
La EMA, disegnata come linea dello zero del pannello, è colorata in base alla pendenza: in salita, in discesa, oppure neutra quando è piatta. La pendenza si misura in σ su una finestra proporzionale a Length, quindi il suo significato resta lo stesso quando Length cambia.
Con "Also on Price Chart" la EMA, le bande e lo sfondo di volatilità si disegnano anche sul grafico principale.
🔹 First-Touch Level e segnali di inversione
Alla prima chiusura oltre ±kσ (Signal Level k, default 2) il prezzo della banda ±kσ su quella candela viene fissato: è il First-Touch Level. Sul grafico dei prezzi è una linea orizzontale ferma; nel pannello è lo stesso prezzo espresso nella σ attuale.
- Rientro del prezzo, triangolo colorato: la chiusura torna dentro il First-Touch Level. È il prezzo stesso a tornare verso la media.
- Rientro della banda, triangolo grigio: lo z-score è tornato dentro ±kσ, ma la chiusura è ancora oltre il First-Touch Level. È rientrata la banda, non il prezzo.
Il livello termina quando la chiusura torna dentro di esso o raggiunge la EMA. Con "Only with Flat EMA" i segnali compaiono solo quando la EMA è piatta, così restano limitati ai mercati che si muovono attorno a una media stabile.
🔹 Volume estremo e sfondo di volatilità
Un rombo segna le candele il cui massimo (o minimo) arriva oltre ±kσ con volume anomalo. Il volume è convertito in z-score rispetto alla sua media, con la stessa ponderazione e la stessa Length della EMA.
Mentre la chiusura è oltre ±kσ lo sfondo si colora: Expansion quando l'ATR corto è molto sopra l'ATR sulla Length della EMA (le candele si stanno allargando), Stable altrimenti. Indica se un'escursione avviene con candele in espansione o di ampiezza normale.
🔹 Livelli del giorno precedente e dashboard
Massimo e minimo del giorno precedente (PDH, PDL) sono mostrati con la loro distanza attuale dalla EMA in σ, come brevi segmenti ed etichette a destra dell'ultima candela. I livelli della settimana e del mese precedenti si accendono dalle impostazioni.
La dashboard mostra la pendenza della EMA su tre timeframe (▲ BULL, ▼ BEAR o FLAT) e il regime di volatilità: ATR(14) rispetto alla sua media delle 24 ore. Con la EMA della dashboard impostata alla stessa Length, la prima colonna coincide con il colore della EMA nel pannello e le altre due mostrano la stessa EMA sui timeframe superiori.
🔶 DETTAGLI
- Deviazione, metodo Exponential (default): varianza = EMA(source²) − EMA(source)². La deviazione usa gli stessi pesi della EMA, come la VWAP pesa per volume, così EMA e bande reagiscono alla stessa velocità.
- Deviazione, metodo Fixed window: distanza quadratica media dalla EMA sulle ultime N barre, tutte con lo stesso peso (N = Length).
- Limite esponenziale: con il metodo Exponential il prezzo non può allontanarsi dalla EMA più di √((N−1)/2) σ: circa 3σ con Length 20, 10σ con 200, 22σ con 999. Le bande oltre quel valore non possono mai essere raggiunte da una chiusura. Lo stesso limite vale per lo z-score del volume.
- Ridisegno: i valori dei timeframe superiori nella dashboard provengono dall'ultima candela chiusa di quel timeframe, e i livelli dei periodi precedenti usano solo periodi conclusi. Triangoli, rombi e sfondo si basano sulla candela corrente: sulla candela in corso possono comparire o sparire finché non chiude. Sulle candele storiche non cambiano.
- Riscaldamento: EMA, σ e ATR lungo hanno bisogno di circa Length barre di storico per assestarsi. La riga della volatilità mostra "NEEDS n BARS" finché non sono disponibili 24 ore di candele.
- I rombi di volume richiedono i dati di volume e non compaiono sui simboli senza volume.
- I timeframe della dashboard più bassi del timeframe del grafico non vengono calcolati e mostrano "BELOW TF". Giorno, settimana e mese seguono la sessione del simbolo.
🔶 ALERT
Quando si crea un alert sono disponibili queste condizioni:
- Re-entry below +kσ / Re-entry above −kσ: lo z-score rientra dentro ±kσ. Comprende sia i rientri del prezzo sia quelli della banda e rispetta "Only with Flat EMA".
- Abnormal volume beyond +kσ / Abnormal volume beyond −kσ: stessa condizione dei rombi.
Usa "Once Per Bar Close" per ricevere l'alert solo sulle candele confermate.
🔶 IMPOSTAZIONI
🔹 EMA & Deviation
- Length: lunghezza della EMA e della deviazione (default 200).
- Source: prezzo usato per la EMA e lo z-score (default close).
- Deviation Method: Exponential (pesi della EMA) o Fixed window (ultime N barre).
- Show EMA: colore, spessore e stile della EMA.
- Also on Price Chart: disegna la EMA, le bande accese e lo sfondo anche sul grafico principale.
🔹 EMA Slope
- Color EMA by Slope: colora la EMA Rising o Falling quando non è piatta.
- Window (× Length): finestra su cui si misura la pendenza, come frazione di Length (default 0,25).
- Flat Threshold (σ): sotto questo movimento in σ la EMA è considerata piatta (default 0,5).
🔹 Bands
- Da Band 1 a Band 5: acceso/spento, distanza in σ, riempimento nel pannello, colori sopra e sotto la EMA, spessore e stile.
- Fill Transparency: trasparenza dei riempimenti delle bande.
🔹 Oscillator Pane
- Pane View: Line (z-score della Source) o Candles (OHLC in σ).
- Show Z-score: colore e spessore della linea, colori delle candele rialziste e ribassiste.
🔹 Signals
- Signal Level k (σ): livello usato dai triangoli di inversione, dai rombi di volume e dallo sfondo di volatilità (default 2).
- Re-entry Triangles: colori per From Above e From Below.
- Band Re-entry: mostra il triangolo grigio quando a rientrare è la banda, non il prezzo.
- Only with Flat EMA: mostra i segnali di inversione solo quando la EMA è piatta.
- Extreme Volume Diamonds: acceso/spento, Volume Threshold (z) (default 3) e colori.
🔹 Volatility Background
- Show Background: acceso/spento.
- Short ATR (bars): lunghezza dell'ATR corto (default 14).
- Expansion Threshold (×): ATR corto ÷ ATR lungo sopra il quale lo sfondo indica Expansion (default 1,5).
🔹 First Touch Level
- In Pane / On Price Chart: dove si disegna il livello; colore, spessore e stile.
🔹 Liquidity Levels
- In Pane / On Price Chart: dove si disegnano i livelli.
- Day / Week / Month: accende o spegne ogni periodo (di default solo Day), con il suo colore.
🔹 Dashboard
- Show Dashboard, Position e Dashboard Size.
- EMA Row: pendenza della EMA della dashboard sui tre timeframe.
- Timeframe 1, 2, 3: colonne della dashboard (default: grafico, 15m, 1h). Scegli timeframe uguali o superiori a quello del grafico.
- Dashboard EMA Length: EMA usata dalla dashboard (default 200).
- ATR ÷ Day Mean: riga della volatilità, con il valore Min sotto il quale mostra LOW.
Questo è uno strumento di analisi. Non fornisce raccomandazioni di acquisto o vendita e non promette risultati futuri. Usalo insieme alla tua analisi e alla tua gestione del rischio.

BlackChart — Wyckoff-based indicators for context, structure, waves and liquidity.
blackchart.co/tv
blackchart.co/tv
면책사항
해당 정보와 게시물은 금융, 투자, 트레이딩 또는 기타 유형의 조언이나 권장 사항으로 간주되지 않으며, 트레이딩뷰에서 제공하거나 보증하는 것이 아닙니다. 자세한 내용은 이용 약관을 참조하세요.
BlackChart — Wyckoff-based indicators for context, structure, waves and liquidity.
blackchart.co/tv
blackchart.co/tv
면책사항
해당 정보와 게시물은 금융, 투자, 트레이딩 또는 기타 유형의 조언이나 권장 사항으로 간주되지 않으며, 트레이딩뷰에서 제공하거나 보증하는 것이 아닙니다. 자세한 내용은 이용 약관을 참조하세요.