업데이트됨
Exhaustion Signal
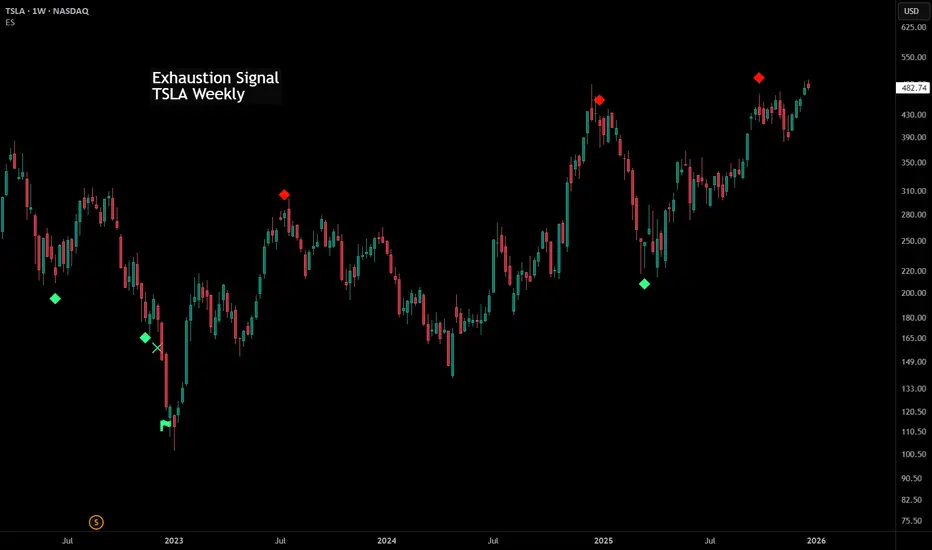
Exhaustion Signal
The Exhaustion Signal involves monitoring a sequence of consecutive bars within a price chart. This analytical approach aims to identify instances where the price exhibits pronounced movement, potentially indicating an upcoming shift in the current trend. The methodology works by assigning values to bars based on their relationship with the closing price of a bar from four periods ago. If a subsequent bar's closing price surpasses the close of the bar from four periods ago, the count advances. However, if the closing price falls below the close of the bar from four periods ago, the count is reset. This counting process continues until a predetermined count value is reached. The appearance of this count value within the exhaustion signal framework signifies a market that has extended beyond typical levels, suggesting the possibility of a temporary pause or even a reversal in the existing trend.
It's important to note that, as per the principles of this approach, the exhaustion signal by itself is not designed to function as a standalone trading indicator. The broader market context and the application of additional analysis techniques influence its significance and potential trading implications.
The Exhaustion Signal involves monitoring a sequence of consecutive bars within a price chart. This analytical approach aims to identify instances where the price exhibits pronounced movement, potentially indicating an upcoming shift in the current trend. The methodology works by assigning values to bars based on their relationship with the closing price of a bar from four periods ago. If a subsequent bar's closing price surpasses the close of the bar from four periods ago, the count advances. However, if the closing price falls below the close of the bar from four periods ago, the count is reset. This counting process continues until a predetermined count value is reached. The appearance of this count value within the exhaustion signal framework signifies a market that has extended beyond typical levels, suggesting the possibility of a temporary pause or even a reversal in the existing trend.
It's important to note that, as per the principles of this approach, the exhaustion signal by itself is not designed to function as a standalone trading indicator. The broader market context and the application of additional analysis techniques influence its significance and potential trading implications.
릴리즈 노트
Minor backend code change - no impact on user.릴리즈 노트
Modified to allow users to change the number of candles counted (default is nine).릴리즈 노트
Added a second exhaustion signal with a default value of 12.릴리즈 노트
Updated the alert mechanism릴리즈 노트
Minor clean-up of script.릴리즈 노트
Minor clean-up and updated chart image릴리즈 노트
Improved the calculation so both exhaustion signal counts only reset after a successful 12 count (or failure beforehand), rather than having the 9 reset on a successful 9 count.릴리즈 노트
Additional improvements to the calculation function.Candles after the first exhaustion signal (9 count) must now close above (or below) the candle 3 prior, rather than 4 prior. This ensures the second exhaustion signal candle closed above (or below) the first exhaustion signal.
릴리즈 노트
Level 3 signals were triggering on incorrect candles. The logic for the calculation section has been overhauled and fixed.릴리즈 노트
Bug fix on the new calculation - cycles were resetting to 0 instead of 1릴리즈 노트
Another bug fix in the calculation logic.릴리즈 노트
Found another issue with how the cycle was being calculated and reset after implementation of the level 3 signal. It should be resolved now.릴리즈 노트
Minor formatting changes릴리즈 노트
Minor formatting updates릴리즈 노트
Minor formatting updates릴리즈 노트
Adding the third level signal created a lot of unexpected complexities to the script. There are certain scenarios of price action that can throw it off and are hard to catch during development and testing.This update attempts to resolve any remaining bugs with the script since introducing the level 3 signal.
릴리즈 노트
Bug fix on some level 3 counts and script optimization.릴리즈 노트
New Feature: AlertsHow to use:
- Enter indicator settings and select which alerts you want to receive (bias and signal level)
- Choose timeframe on chart
- Right click on signal and select Add Alert on ES
- Leave it set to Any alert() function call
Before setting another alert, make sure to update the settings to the alerts you want to receive for that ticker and timeframe.
Additional code cleanup and optimization was done.
릴리즈 노트
- Custom Thresholds: You can now manually adjust the specific counts for Levels 1, 2, and 3 in the settings.
- Icon Sizing: Added an option to change the visual size of signal markers (Tiny, Small, or Normal).
- Enhanced Alerts: Switched to specific alertcondition triggers. You can now create distinct alerts for individual levels (e.g., "Bullish L2 Only") directly from the Create Alert menu.
- UI Cleanup: Settings are now organized into clear groups with tooltips for better usability.
릴리즈 노트
Indicator now works on all candle types릴리즈 노트
- New "Any alert() function call" alert covers all enabled levels in one alert
- New "Show Only Confirmed Signals" option shows icons only after the bar closes
- Status line no longer shows a row of zeros
- Threshold settings now explain their limits
- Renko, Point & Figure, Kagi, Line Break and Range charts now show an error

면책사항
해당 정보와 게시물은 금융, 투자, 트레이딩 또는 기타 유형의 조언이나 권장 사항으로 간주되지 않으며, 트레이딩뷰에서 제공하거나 보증하는 것이 아닙니다. 자세한 내용은 이용 약관을 참조하세요.
면책사항
해당 정보와 게시물은 금융, 투자, 트레이딩 또는 기타 유형의 조언이나 권장 사항으로 간주되지 않으며, 트레이딩뷰에서 제공하거나 보증하는 것이 아닙니다. 자세한 내용은 이용 약관을 참조하세요.