Laguerre Filter_HCM
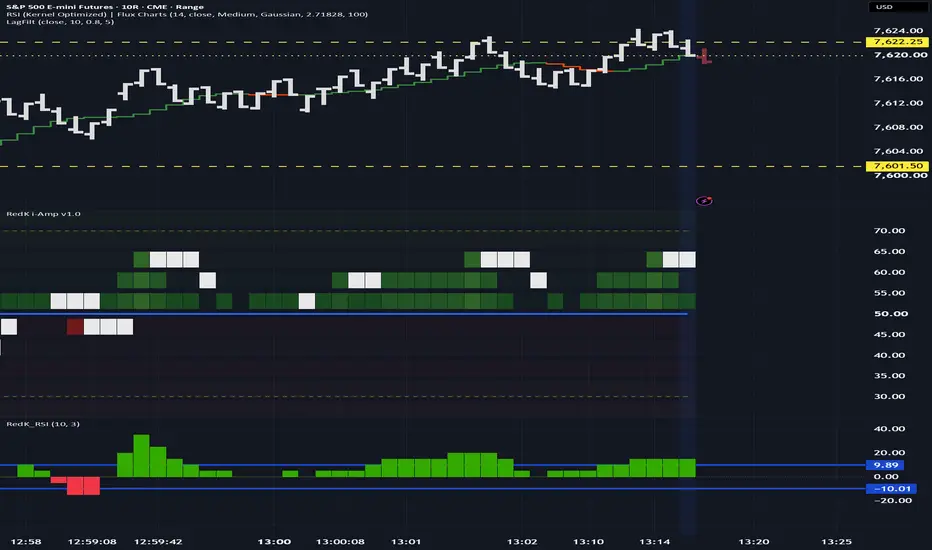
Adapted Laguerre Filter _ Ehler
How to interpret it on a trading chart
Read it primarily as a trend baseline:
Price above a rising filter suggests bullish alignment.
Price below a falling filter suggests bearish alignment.
A flattening filter with repeated price crossings signals a less useful environment for trend-following entries.
A slope change tells you the smoothed price direction has turned—not that a durable reversal is guaranteed.
The attraction is a relatively clean line that can remain responsive. The limitation is the same fundamental trade-off you face with other smoothers: removing more noise also delays recognition of genuine changes. Claims that it is universally “better than an EMA” need a specific comparison of settings and smoothness, not just a visual impression.
How to interpret it on a trading chart
Read it primarily as a trend baseline:
Price above a rising filter suggests bullish alignment.
Price below a falling filter suggests bearish alignment.
A flattening filter with repeated price crossings signals a less useful environment for trend-following entries.
A slope change tells you the smoothed price direction has turned—not that a durable reversal is guaranteed.
The attraction is a relatively clean line that can remain responsive. The limitation is the same fundamental trade-off you face with other smoothers: removing more noise also delays recognition of genuine changes. Claims that it is universally “better than an EMA” need a specific comparison of settings and smoothness, not just a visual impression.

면책사항
해당 정보와 게시물은 금융, 투자, 트레이딩 또는 기타 유형의 조언이나 권장 사항으로 간주되지 않으며, 트레이딩뷰에서 제공하거나 보증하는 것이 아닙니다. 자세한 내용은 이용 약관을 참조하세요.
면책사항
해당 정보와 게시물은 금융, 투자, 트레이딩 또는 기타 유형의 조언이나 권장 사항으로 간주되지 않으며, 트레이딩뷰에서 제공하거나 보증하는 것이 아닙니다. 자세한 내용은 이용 약관을 참조하세요.