OPEN-SOURCE SCRIPT
업데이트됨 Volatility Drag Oscillator
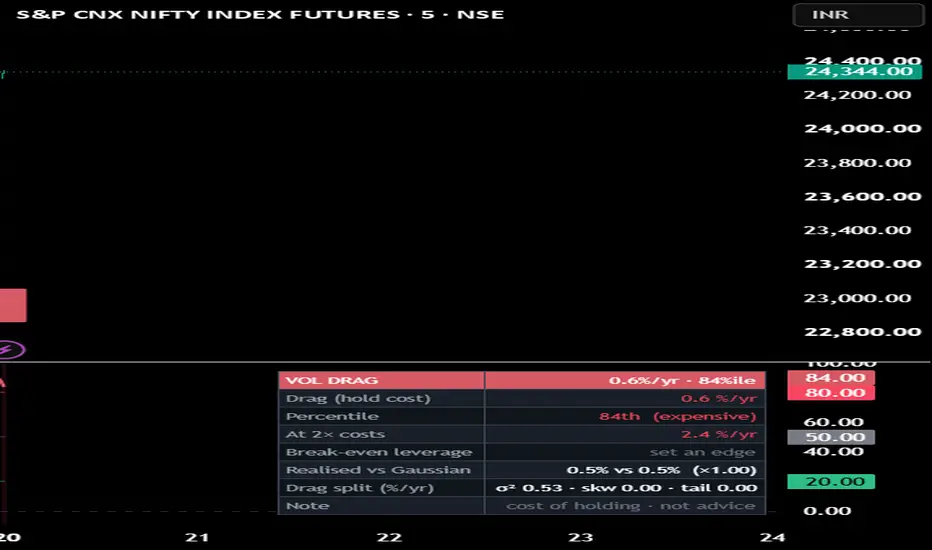
Volatility Drag Oscillator — what is holding exposure costing you, and what does leverage do to it?
Compound growth is g = μ − σ²/2; under leverage, g(L) = L·μ − L²·σ²/2. Return scales with L, drag scales
with L² — which is the whole reason leverage does not raise your probability of success. Volatility is
estimable in hundreds of bars; drift needs decades. So this tool measures only the knowable half:
- DRAG = σ²/2 annualised (Yang-Zhang by default; Close-to-close / Parkinson / Garman-Klass /
Rogers-Satchell selectable to see estimator disagreement = gap-risk information), EWMA-smoothed and
ranked into a percentile so you know if today is a cheap or expensive time to hold.
- DRAG DECOMPOSITION — realised drag split into its exact cumulant pieces: variance (σ²/2) + skew +
excess-kurtosis, shown as "σ² · skw · tail" in %/yr. A fat-tail warning tells you HOW MUCH of your
drag is tails, not just that they exist — and it compares realised drag to its own Gaussian part, so
it can't be fooled by estimator choice.
- LEVERAGE CURVE — drag at 1×/2×/3×, plus break-even L_be = 2μ/σ² and Kelly = μ/σ², shown ONLY as
conditionals on an edge YOU enter. The script never estimates drift, and says why.
READ IT how you like: a familiar 0-100 percentile OSCILLATOR in the pane (cheap<20, expensive>80,
midline 50, like an RSI of holding-cost), or the absolute drag %/yr line. On price, a heat-RIBBON and
green/red regime triangles show cheap→expensive to hold — VOLATILITY regime, direction-agnostic. A red
marker means "expensive, size down", never "go short".
No directional claim and no backtest — there is nothing here to fit. Descriptive risk context, not advice.
Leverage magnifies losses; this shows one cost of it, not all risks.
Compound growth is g = μ − σ²/2; under leverage, g(L) = L·μ − L²·σ²/2. Return scales with L, drag scales
with L² — which is the whole reason leverage does not raise your probability of success. Volatility is
estimable in hundreds of bars; drift needs decades. So this tool measures only the knowable half:
- DRAG = σ²/2 annualised (Yang-Zhang by default; Close-to-close / Parkinson / Garman-Klass /
Rogers-Satchell selectable to see estimator disagreement = gap-risk information), EWMA-smoothed and
ranked into a percentile so you know if today is a cheap or expensive time to hold.
- DRAG DECOMPOSITION — realised drag split into its exact cumulant pieces: variance (σ²/2) + skew +
excess-kurtosis, shown as "σ² · skw · tail" in %/yr. A fat-tail warning tells you HOW MUCH of your
drag is tails, not just that they exist — and it compares realised drag to its own Gaussian part, so
it can't be fooled by estimator choice.
- LEVERAGE CURVE — drag at 1×/2×/3×, plus break-even L_be = 2μ/σ² and Kelly = μ/σ², shown ONLY as
conditionals on an edge YOU enter. The script never estimates drift, and says why.
READ IT how you like: a familiar 0-100 percentile OSCILLATOR in the pane (cheap<20, expensive>80,
midline 50, like an RSI of holding-cost), or the absolute drag %/yr line. On price, a heat-RIBBON and
green/red regime triangles show cheap→expensive to hold — VOLATILITY regime, direction-agnostic. A red
marker means "expensive, size down", never "go short".
No directional claim and no backtest — there is nothing here to fit. Descriptive risk context, not advice.
Leverage magnifies losses; this shows one cost of it, not all risks.
릴리즈 노트
minor change오픈 소스 스크립트
트레이딩뷰의 진정한 정신에 따라, 이 스크립트의 작성자는 이를 오픈소스로 공개하여 트레이더들이 기능을 검토하고 검증할 수 있도록 했습니다. 작성자에게 찬사를 보냅니다! 이 코드는 무료로 사용할 수 있지만, 코드를 재게시하는 경우 하우스 룰이 적용된다는 점을 기억하세요.

면책사항
해당 정보와 게시물은 금융, 투자, 트레이딩 또는 기타 유형의 조언이나 권장 사항으로 간주되지 않으며, 트레이딩뷰에서 제공하거나 보증하는 것이 아닙니다. 자세한 내용은 이용 약관을 참조하세요.
오픈 소스 스크립트
트레이딩뷰의 진정한 정신에 따라, 이 스크립트의 작성자는 이를 오픈소스로 공개하여 트레이더들이 기능을 검토하고 검증할 수 있도록 했습니다. 작성자에게 찬사를 보냅니다! 이 코드는 무료로 사용할 수 있지만, 코드를 재게시하는 경우 하우스 룰이 적용된다는 점을 기억하세요.
면책사항
해당 정보와 게시물은 금융, 투자, 트레이딩 또는 기타 유형의 조언이나 권장 사항으로 간주되지 않으며, 트레이딩뷰에서 제공하거나 보증하는 것이 아닙니다. 자세한 내용은 이용 약관을 참조하세요.