OPEN-SOURCE SCRIPT
Max Pain Options [QuantLabs] v5 (Balanced)
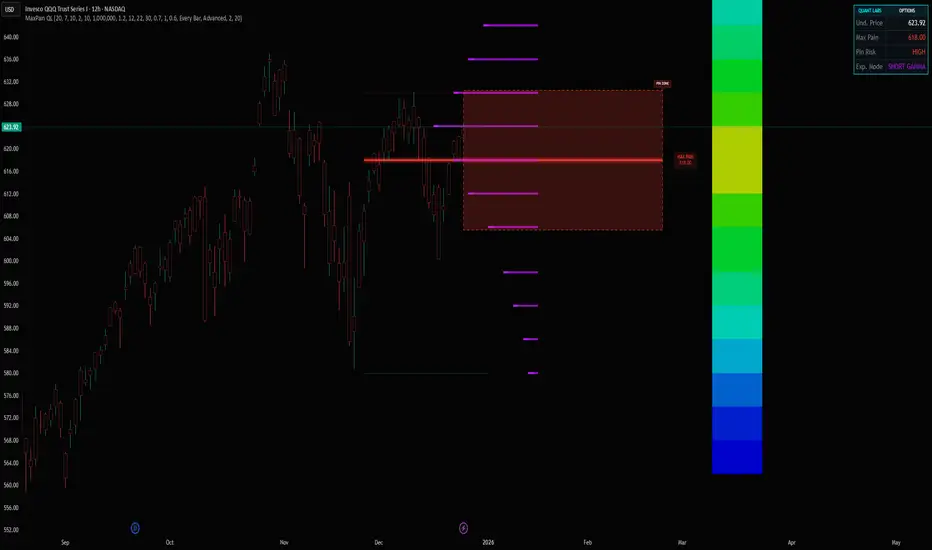
Institutional Grade Options Analysis: Max Pain, Gamma & Pin Risk
For years, TradingView users have been flying blind without access to Options Chain data. QuantLabs: Max Pain & Gamma Exposure changes that. This is not just a support/resistance indicator—it is a sophisticated, algorithmic model that reverse-engineers the incentives of Market Makers using synthetic Black-Scholes logic.
This tool visualizes the "invisible hand" of the market: the hedging requirements of large dealers who are forced to buy or sell to keep their books neutral.
CORE FEATURES:
🔴 Max Pain Gravity Model The bright red line represents the "Max Pain" strike—the price level where the maximum amount of Options Open Interest (Calls + Puts) expires worthless.
Theory: As OpEx (Expiration) approaches, Market Makers maximize profits by pinning the price to this level.
Strategy: Use this as a mean-reversion target. If price is far away, look for a snap-back to the red line.
🟣 Gamma Exposure Profiles (The Purple Lines) These neon histograms show you the estimated "Gamma Walls."
Long Gamma: Dealers trade against the trend (stabilizing price).
Short Gamma: Dealers trade with the trend (accelerating volatility).
Visual: The larger the purple bar, the harder it will be for price to break through that level.
📦 Algorithmic "Pin Risk" Zones The dashed red box highlights the "Kill Zone." When price enters this area near expiration, volatility often dies as dealers pin the asset to kill retail premiums.
Warning: Do not expect breakouts while inside the Pin Zone.
📊 Institutional HUD A clean, non-intrusive dashboard provides real-time Greeks and risk analysis:
Pin Risk: High/Medium/Low probability of a pinned close.
Exp Mode: Detects if the market is in "Short Gamma" (Squeeze territory) or "Long Gamma" (Chop territory).
HOW IT WORKS (The Math): Since live options data is not available via Pine Script, this engine uses a proprietary Synthetic OI Distribution Model. It inputs Volume, Volatility (IV), and Time-to-Expiry into a modified Black-Scholes equation to probability-map where the heavy open interest likely sits.
SETTINGS & CUSTOMIZATION:
Responsiveness: Tuned for the "Goldilocks Zone" (Spread: 12, Decay: 22) to catch local liquidity walls without over-fitting.
Visuals: Designed for Dark Mode. High-contrast Neon aesthetics for maximum readability.
For years, TradingView users have been flying blind without access to Options Chain data. QuantLabs: Max Pain & Gamma Exposure changes that. This is not just a support/resistance indicator—it is a sophisticated, algorithmic model that reverse-engineers the incentives of Market Makers using synthetic Black-Scholes logic.
This tool visualizes the "invisible hand" of the market: the hedging requirements of large dealers who are forced to buy or sell to keep their books neutral.
CORE FEATURES:
🔴 Max Pain Gravity Model The bright red line represents the "Max Pain" strike—the price level where the maximum amount of Options Open Interest (Calls + Puts) expires worthless.
Theory: As OpEx (Expiration) approaches, Market Makers maximize profits by pinning the price to this level.
Strategy: Use this as a mean-reversion target. If price is far away, look for a snap-back to the red line.
🟣 Gamma Exposure Profiles (The Purple Lines) These neon histograms show you the estimated "Gamma Walls."
Long Gamma: Dealers trade against the trend (stabilizing price).
Short Gamma: Dealers trade with the trend (accelerating volatility).
Visual: The larger the purple bar, the harder it will be for price to break through that level.
📦 Algorithmic "Pin Risk" Zones The dashed red box highlights the "Kill Zone." When price enters this area near expiration, volatility often dies as dealers pin the asset to kill retail premiums.
Warning: Do not expect breakouts while inside the Pin Zone.
📊 Institutional HUD A clean, non-intrusive dashboard provides real-time Greeks and risk analysis:
Pin Risk: High/Medium/Low probability of a pinned close.
Exp Mode: Detects if the market is in "Short Gamma" (Squeeze territory) or "Long Gamma" (Chop territory).
HOW IT WORKS (The Math): Since live options data is not available via Pine Script, this engine uses a proprietary Synthetic OI Distribution Model. It inputs Volume, Volatility (IV), and Time-to-Expiry into a modified Black-Scholes equation to probability-map where the heavy open interest likely sits.
SETTINGS & CUSTOMIZATION:
Responsiveness: Tuned for the "Goldilocks Zone" (Spread: 12, Decay: 22) to catch local liquidity walls without over-fitting.
Visuals: Designed for Dark Mode. High-contrast Neon aesthetics for maximum readability.
오픈 소스 스크립트
트레이딩뷰의 진정한 정신에 따라, 이 스크립트의 작성자는 이를 오픈소스로 공개하여 트레이더들이 기능을 검토하고 검증할 수 있도록 했습니다. 작성자에게 찬사를 보냅니다! 이 코드는 무료로 사용할 수 있지만, 코드를 재게시하는 경우 하우스 룰이 적용된다는 점을 기억하세요.

면책사항
해당 정보와 게시물은 금융, 투자, 트레이딩 또는 기타 유형의 조언이나 권장 사항으로 간주되지 않으며, 트레이딩뷰에서 제공하거나 보증하는 것이 아닙니다. 자세한 내용은 이용 약관을 참조하세요.
오픈 소스 스크립트
트레이딩뷰의 진정한 정신에 따라, 이 스크립트의 작성자는 이를 오픈소스로 공개하여 트레이더들이 기능을 검토하고 검증할 수 있도록 했습니다. 작성자에게 찬사를 보냅니다! 이 코드는 무료로 사용할 수 있지만, 코드를 재게시하는 경우 하우스 룰이 적용된다는 점을 기억하세요.
면책사항
해당 정보와 게시물은 금융, 투자, 트레이딩 또는 기타 유형의 조언이나 권장 사항으로 간주되지 않으며, 트레이딩뷰에서 제공하거나 보증하는 것이 아닙니다. 자세한 내용은 이용 약관을 참조하세요.