OPEN-SOURCE SCRIPT
Pre-Market High/Low + ORBs + EMAs + VWAP + Pivots [v6]
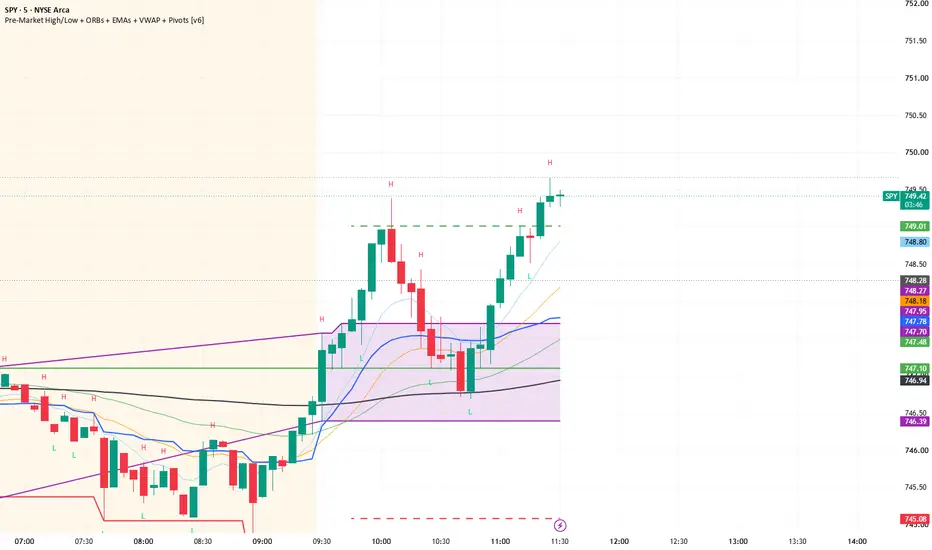
## Pre-Market Levels, ORBs, EMAs, VWAP & Confirmed Pivots
This all-in-one intraday indicator combines frequently used market-reference levels into a single, clean chart overlay. It is designed to help traders monitor pre-market structure, opening ranges, trend context, projected targets, and confirmed swing points.
### Features
**Pre-Market High and Low**
Tracks the highest and lowest prices during the U.S. pre-market session from **4:00 AM to 9:30 AM Eastern Time**. These levels remain visible throughout the trading day as potential support, resistance, liquidity, and breakout reference points.
**First Opening Range**
Calculates the high and low formed between **9:30 AM and 9:45 AM Eastern Time**.
**Second Opening Range**
Calculates an additional high and low between **2:30 PM and 2:40 PM Eastern Time** for traders monitoring afternoon price expansion.
**100% ORB Projection Targets**
After an opening range is complete, the indicator projects one full range above and below it:
```text
Upside target = ORB high + ORB size
Downside target = ORB low − ORB size
```
The morning ORB targets are replaced by the afternoon ORB targets after the second opening range is complete.
**Moving Averages**
Includes the following exponential moving averages:
- 9 EMA
- 21 EMA
- 50 EMA
- 100 EMA
- 200 EMA
These can help evaluate short-, medium-, and long-term trend alignment.
**VWAP**
Displays the session Volume Weighted Average Price as an intraday measure of price relative to traded volume.
**Confirmed Pivot Highs and Lows**
Identifies confirmed swing points:
- Red **H** markers indicate pivot highs.
- Green **L** markers indicate pivot lows.
- The pivot period can be adjusted in the indicator settings.
- Pivot highs and lows can be shown or hidden independently.
Pivots require bars on both sides of the swing to be confirmed. Markers are displayed on the candle where the swing occurred, but the pivot was not known until the required confirmation bars had closed.
### Intended Use
This indicator can help traders identify:
- Pre-market breakouts and rejections
- Opening-range breakouts
- Potential support and resistance
- ORB expansion targets
- Trend alignment using EMAs and VWAP
- Confirmed short-term market structure
The indicator is intended primarily for intraday charts and uses the **America/New_York** timezone for its session calculations.
### Important Notice
This indicator provides technical reference levels only. It does not generate automatic trade entries or guarantee that projected targets will be reached. Always use appropriate confirmation, risk management, and independent analysis. This script is for educational and informational purposes only.
This all-in-one intraday indicator combines frequently used market-reference levels into a single, clean chart overlay. It is designed to help traders monitor pre-market structure, opening ranges, trend context, projected targets, and confirmed swing points.
### Features
**Pre-Market High and Low**
Tracks the highest and lowest prices during the U.S. pre-market session from **4:00 AM to 9:30 AM Eastern Time**. These levels remain visible throughout the trading day as potential support, resistance, liquidity, and breakout reference points.
**First Opening Range**
Calculates the high and low formed between **9:30 AM and 9:45 AM Eastern Time**.
**Second Opening Range**
Calculates an additional high and low between **2:30 PM and 2:40 PM Eastern Time** for traders monitoring afternoon price expansion.
**100% ORB Projection Targets**
After an opening range is complete, the indicator projects one full range above and below it:
```text
Upside target = ORB high + ORB size
Downside target = ORB low − ORB size
```
The morning ORB targets are replaced by the afternoon ORB targets after the second opening range is complete.
**Moving Averages**
Includes the following exponential moving averages:
- 9 EMA
- 21 EMA
- 50 EMA
- 100 EMA
- 200 EMA
These can help evaluate short-, medium-, and long-term trend alignment.
**VWAP**
Displays the session Volume Weighted Average Price as an intraday measure of price relative to traded volume.
**Confirmed Pivot Highs and Lows**
Identifies confirmed swing points:
- Red **H** markers indicate pivot highs.
- Green **L** markers indicate pivot lows.
- The pivot period can be adjusted in the indicator settings.
- Pivot highs and lows can be shown or hidden independently.
Pivots require bars on both sides of the swing to be confirmed. Markers are displayed on the candle where the swing occurred, but the pivot was not known until the required confirmation bars had closed.
### Intended Use
This indicator can help traders identify:
- Pre-market breakouts and rejections
- Opening-range breakouts
- Potential support and resistance
- ORB expansion targets
- Trend alignment using EMAs and VWAP
- Confirmed short-term market structure
The indicator is intended primarily for intraday charts and uses the **America/New_York** timezone for its session calculations.
### Important Notice
This indicator provides technical reference levels only. It does not generate automatic trade entries or guarantee that projected targets will be reached. Always use appropriate confirmation, risk management, and independent analysis. This script is for educational and informational purposes only.
오픈 소스 스크립트
트레이딩뷰의 진정한 정신에 따라, 이 스크립트의 작성자는 이를 오픈소스로 공개하여 트레이더들이 기능을 검토하고 검증할 수 있도록 했습니다. 작성자에게 찬사를 보냅니다! 이 코드는 무료로 사용할 수 있지만, 코드를 재게시하는 경우 하우스 룰이 적용된다는 점을 기억하세요.

면책사항
해당 정보와 게시물은 금융, 투자, 트레이딩 또는 기타 유형의 조언이나 권장 사항으로 간주되지 않으며, 트레이딩뷰에서 제공하거나 보증하는 것이 아닙니다. 자세한 내용은 이용 약관을 참조하세요.
오픈 소스 스크립트
트레이딩뷰의 진정한 정신에 따라, 이 스크립트의 작성자는 이를 오픈소스로 공개하여 트레이더들이 기능을 검토하고 검증할 수 있도록 했습니다. 작성자에게 찬사를 보냅니다! 이 코드는 무료로 사용할 수 있지만, 코드를 재게시하는 경우 하우스 룰이 적용된다는 점을 기억하세요.
면책사항
해당 정보와 게시물은 금융, 투자, 트레이딩 또는 기타 유형의 조언이나 권장 사항으로 간주되지 않으며, 트레이딩뷰에서 제공하거나 보증하는 것이 아닙니다. 자세한 내용은 이용 약관을 참조하세요.