업데이트됨
Swing Trade Scanner Setup Grade and Verdict
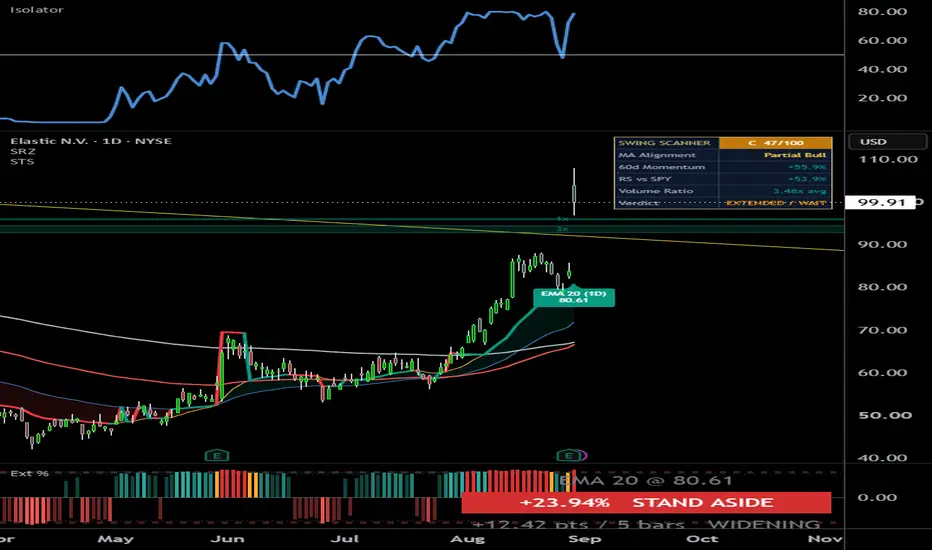
Grades the stock on your chart as a long swing setup — a 0–100 score, an A+ to D grade, and a plain-English verdict.
You've found a stock. Is it actually a setup? Swing Trade Scanner grades the chart in front of you the way a swing trader reads it — trend, momentum, relative strength, volume — and gives you one honest answer: a score, a grade, and a verdict in plain English.
It works on its own — nothing else required.
Why one score instead of five separate indicators?
Every check in this script exists on its own — but alone, each one whipsaws. What makes a swing setup is confluence: trend, momentum, proximity to highs, relative strength, and volume confirming each other at the same time.
The Scanner's contribution is the weighting and the interaction between the checks: MA alignment counts most because trend is what pays swing traders, and the extension penalty can override an otherwise perfect score — because the same chart that grades well near the fast MA is a bad entry 8% above it. That interaction is what a stack of separate indicators won't show you.
What goes into the score (0–100)
Five checks, each weighted by how much it matters:
Then one guardrail: the extension penalty. More than 6% above the fast MA and the score gets docked (−12 points, −20 past 10%). Chasing a stretched chart is how good setups become bad entries — the Scanner won't grade one highly.
The verdict reads in plain English
What you see on the chart
Long setups only
This tool grades the long (buy) side. On a downtrending chart it won't invent an opportunity — it shows Full Bear and AVOID and tells you to look elsewhere.
Settings — defaults work out of the box
⚠ Educational tool for reading and grading charts. The grade measures how complete a setup is by these rules — it does not generate buy/sell signals or predict price. Not financial advice.
You've found a stock. Is it actually a setup? Swing Trade Scanner grades the chart in front of you the way a swing trader reads it — trend, momentum, relative strength, volume — and gives you one honest answer: a score, a grade, and a verdict in plain English.
It works on its own — nothing else required.
Why one score instead of five separate indicators?
Every check in this script exists on its own — but alone, each one whipsaws. What makes a swing setup is confluence: trend, momentum, proximity to highs, relative strength, and volume confirming each other at the same time.
The Scanner's contribution is the weighting and the interaction between the checks: MA alignment counts most because trend is what pays swing traders, and the extension penalty can override an otherwise perfect score — because the same chart that grades well near the fast MA is a bad entry 8% above it. That interaction is what a stack of separate indicators won't show you.
What goes into the score (0–100)
Five checks, each weighted by how much it matters:
- MA alignment (up to 35 pts) — is price stacked cleanly above the 4-MA ribbon? A full bull stack (price > fast MA > each slower MA) earns full points.
- Momentum (up to 20) — how far price has moved over the lookback (60 bars by default).
- Distance from the recent high (up to 20) — leaders sit near their highs; a stock 10% below its high has repair work to do first.
- Relative strength vs SPY (up to 15) — is the stock beating the market (SPY = S&P 500 ETF), not just rising with it?
- Volume (up to 10) — is it trading above its 20-day average?
Then one guardrail: the extension penalty. More than 6% above the fast MA and the score gets docked (−12 points, −20 past 10%). Chasing a stretched chart is how good setups become bad entries — the Scanner won't grade one highly.
The verdict reads in plain English
- HIGH QUALITY (score 75+) — everything lined up.
- MODERATE (55–74) — decent, not complete.
- WEAK (40–54) — most of the checklist is missing.
- AVOID (under 40) — not a long setup right now.
- EXTENDED / WAIT — the setup grades well BUT price is stretched more than 6% above the fast MA. Good stock, bad moment. Let it pull in.
What you see on the chart
- The 4-MA ribbon — four moving averages (EMA 20 / 50 / 100 / 200 by default; EMA, SMA or WMA), with the zone between the two fastest shaded green in an uptrend, red in a downtrend.
- Candle coloring (optional) — green in a full bull stack, teal in a partial one, red in a full bear stack, so the trend state reads at a glance.
- The dashboard — grade + score up top, then the four core metrics (MA Alignment, 60-bar Momentum, RS vs SPY, Volume Ratio) and the Verdict row.
Long setups only
This tool grades the long (buy) side. On a downtrending chart it won't invent an opportunity — it shows Full Bear and AVOID and tells you to look elsewhere.
Settings — defaults work out of the box
- MA ribbon — four lengths, MA type, and colors.
- Lookback (60 bars) — the window for momentum, relative strength, and the recent high.
- Volume MA length (20).
- Table position, text size, dark/light theme, and status colors.
⚠ Educational tool for reading and grading charts. The grade measures how complete a setup is by these rules — it does not generate buy/sell signals or predict price. Not financial advice.
릴리즈 노트
v1.1 — display fix: percentages and volume ratio were printed wrongThe Momentum %, RS vs SPY % and Volume Ratio rows were formatted with the
wrong pattern. In a Pine format string only # and 0 act as digit
placeholders — any other digit is printed literally and the number is
rounded to a whole number first. The table used "#.1" and "#.2", so:
a true 5.86% was printed as "6.1%"
a true 0.35x was printed as "0.2x avg"
Every percentage in the table ended in .1, and volume ratios clustered onto
a handful of wrong values regardless of the symbol.
Important: the calculations were never wrong. The score, the letter grade,
the verdict and the extension guardrail were all computed from the true
values throughout — only the printed text was corrupted. Your grades do not
change with this update. The numbers next to them now match what the
indicator was actually using.
If you have been reading those three rows to sanity-check a grade, they are
worth a second look now that they are accurate.
릴리즈 노트
Republished to correct the chart shown on this listing. No changes to theindicator — the calculations, score, grade and verdict are identical to the
previous version.
릴리즈 노트
Fix: EXTENDED / WAIT could go missing on the most stretched charts. The verdictwas checked against the score after the extension penalty was subtracted, so the
penalty pushed the total under the threshold its own warning needed and the
verdict fell through to WEAK instead. It now checks the score before the penalty.
Scores, grades and the dashboard are unchanged — only the Verdict wording.

면책사항
해당 정보와 게시물은 금융, 투자, 트레이딩 또는 기타 유형의 조언이나 권장 사항으로 간주되지 않으며, 트레이딩뷰에서 제공하거나 보증하는 것이 아닙니다. 자세한 내용은 이용 약관을 참조하세요.
면책사항
해당 정보와 게시물은 금융, 투자, 트레이딩 또는 기타 유형의 조언이나 권장 사항으로 간주되지 않으며, 트레이딩뷰에서 제공하거나 보증하는 것이 아닙니다. 자세한 내용은 이용 약관을 참조하세요.