업데이트됨
Premium Linear Regression - The Quant Science
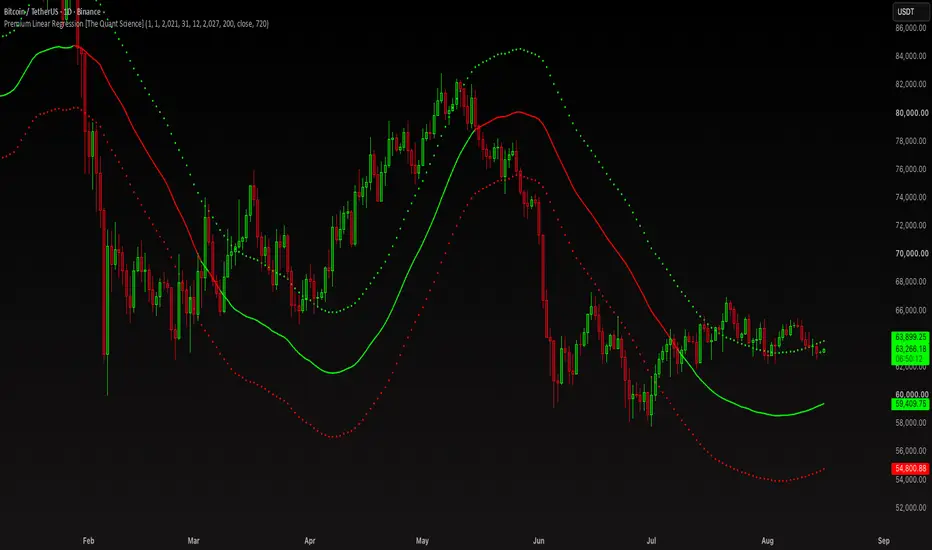
This script calculates the average deviation of the source data from the linear regression. When used with the indicator, it can plot the data line and display various pieces of information, including the maximum average dispersion around the linear regression.
The code includes various user configurations, allowing for the specification of the start and end dates of the period for which to calculate linear regression, the length of the period to use for the calculation, and the data source to use.
The indicator is designed for multi-timeframe use and to facilitate analysis for traders who use regression models in their analysis. It displays a green linear regression line when the price is above the line and a red line when the price is below. The indicator also highlights areas of dispersion around the regression using circles, with bullish areas shown in green and bearish areas shown in red.
The code includes various user configurations, allowing for the specification of the start and end dates of the period for which to calculate linear regression, the length of the period to use for the calculation, and the data source to use.
The indicator is designed for multi-timeframe use and to facilitate analysis for traders who use regression models in their analysis. It displays a green linear regression line when the price is above the line and a red line when the price is below. The indicator also highlights areas of dispersion around the regression using circles, with bullish areas shown in green and bearish areas shown in red.
릴리즈 노트
Added a function to adjust the linear regression deviation. The indicator adjusts the deviation data calculating only the time period selected by the user interface.릴리즈 노트
- Pine Script 6 Update
Description Update | 2026
This indicator automatically calculates a dynamic channel based on a multi-timeframe linear regression, plotting the central line and two outer support/resistance bands calculated based on the average price deviation.
- Time Filter: allows you to define a start and end date. Deviation calculations are performed only within this range.
- Length and Source: sets the length of the linear regression cycle (default: 200 bars) and the data source (default: closing price).
- Higher Timeframe (MTF): uses a daily chart (1D by default) to calculate the regression, regardless of the timeframe on which the indicator is placed.
Instead of using the classic standard deviation (as in the standard regression channel or Bollinger Bands), the indicator calculates a cumulative historical average deviation:
- When the price is above the regression line: records the distance between the price and the regression line, accumulates it, and keeps track of how many times this condition has occurred to calculate an average upward distance.
- When the price is below the regression line: records the distance between the regression line and the price, accumulates it, and calculates the average downward distance.
Dynamic Color: The line turns green if the current price is above the linear regression line and red if it is below.
🟢 Green Dots (Top): Overbought/resistance zone where the price tends to deviate upward from the average.
🔴 Red Dots (Bottom): Oversold/support zone where the price tends to deviate downward from the average.
❌ Always use timeframes that are lower than the current chart, and never higher.

면책사항
해당 정보와 게시물은 금융, 투자, 트레이딩 또는 기타 유형의 조언이나 권장 사항으로 간주되지 않으며, 트레이딩뷰에서 제공하거나 보증하는 것이 아닙니다. 자세한 내용은 이용 약관을 참조하세요.
면책사항
해당 정보와 게시물은 금융, 투자, 트레이딩 또는 기타 유형의 조언이나 권장 사항으로 간주되지 않으며, 트레이딩뷰에서 제공하거나 보증하는 것이 아닙니다. 자세한 내용은 이용 약관을 참조하세요.