OPEN-SOURCE SCRIPT
업데이트됨 MACD Matrix: Angle & Settlement
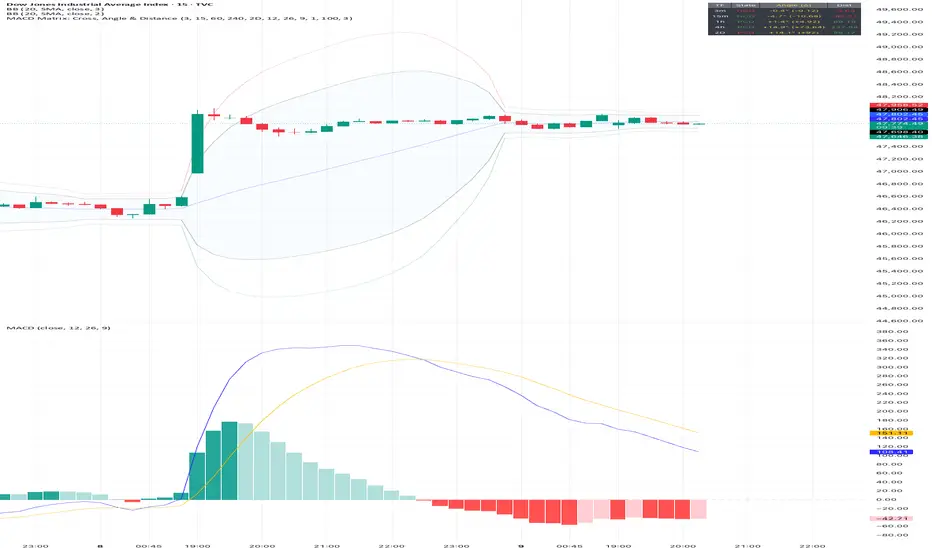
This indicator is a comprehensive Multi-Timeframe (MTF) Dashboard designed for technical traders who rely on MACD not just for crossovers, but for Momentum Angle and Settlement (Hooks).
Instead of cluttering your screen with 5 different MACD charts, this Matrix calculates the math in the background and presents a clean "Heads-Up Display" of the MACD state across your specific timeframes (Default: 3m, 15m, 1h, 4h, 16h).
The Concept: "Angle Settlement"
Standard MACD indicators only show you when a cross happens. By then, the move is often halfway over. This script focuses on the Angle (Slope) of the MACD line to predict turns before they happen:
Steep Angle: Momentum is accelerating. (Strong Trend)
Settling Angle: The slope is flattening out. The MACD line is "hooking." (Reversal/Cross Imminent)
Dashboard Columns Explained
TF (Timeframe): Auto-formats your settings into readable text (e.g., "240" becomes "4h").
Zone:
> 0 (Green): MACD is above the Zero Line (Bullish Trend context).
< 0 (Red): MACD is below the Zero Line (Bearish Trend context).
Cross:
PCO (Green): Positive Crossover (MACD > Signal).
NCO (Red): Negative Crossover (MACD < Signal).
Deg (°):
The calculated mathematical angle of the MACD line.
Positive (+): Momentum is rising.
Negative (-): Momentum is falling.
State (The Strategy):
STEEP (Bright Color): The angle is increasing. Do not trade against this momentum.
SETTLE (Dim Color): The angle is decreasing compared to the previous bar. The momentum is "cooling off," often signaling a "Hook" or an upcoming crossover.
Settings & Customization
Custom Timeframes: You can freely change TF-1, TF-2, etc., in the settings. The table labels will auto-update (e.g., if you change 4h to 1D, the table will display "1D").
MACD Lengths: Fully customizable (Default 12, 26, 9).
Angle Sensitivity: A multiplier to calibrate the "Degrees" to your specific asset class (Crypto, Forex, or Indices). If angles look too small, increase this value.
Instead of cluttering your screen with 5 different MACD charts, this Matrix calculates the math in the background and presents a clean "Heads-Up Display" of the MACD state across your specific timeframes (Default: 3m, 15m, 1h, 4h, 16h).
The Concept: "Angle Settlement"
Standard MACD indicators only show you when a cross happens. By then, the move is often halfway over. This script focuses on the Angle (Slope) of the MACD line to predict turns before they happen:
Steep Angle: Momentum is accelerating. (Strong Trend)
Settling Angle: The slope is flattening out. The MACD line is "hooking." (Reversal/Cross Imminent)
Dashboard Columns Explained
TF (Timeframe): Auto-formats your settings into readable text (e.g., "240" becomes "4h").
Zone:
> 0 (Green): MACD is above the Zero Line (Bullish Trend context).
< 0 (Red): MACD is below the Zero Line (Bearish Trend context).
Cross:
PCO (Green): Positive Crossover (MACD > Signal).
NCO (Red): Negative Crossover (MACD < Signal).
Deg (°):
The calculated mathematical angle of the MACD line.
Positive (+): Momentum is rising.
Negative (-): Momentum is falling.
State (The Strategy):
STEEP (Bright Color): The angle is increasing. Do not trade against this momentum.
SETTLE (Dim Color): The angle is decreasing compared to the previous bar. The momentum is "cooling off," often signaling a "Hook" or an upcoming crossover.
Settings & Customization
Custom Timeframes: You can freely change TF-1, TF-2, etc., in the settings. The table labels will auto-update (e.g., if you change 4h to 1D, the table will display "1D").
MACD Lengths: Fully customizable (Default 12, 26, 9).
Angle Sensitivity: A multiplier to calibrate the "Degrees" to your specific asset class (Crypto, Forex, or Indices). If angles look too small, increase this value.
릴리즈 노트
This update brings a massive overhaul to the underlying math engine of the indicator, solving the classic "aspect ratio" problem of angle calculations, while dramatically cleaning up the visual footprint on the chart.1. The "True Angle" Normalization Engine (Major Math Overhaul)
The Problem: In previous versions, the MACD angle was calculated using raw values and manual scale factors. Because MACD is an absolute oscillator, its raw movement changes drastically between assets (e.g., Bitcoin moving by 50 vs. Forex moving by 0.0005), making the angle completely inaccurate when switching charts.
The Solution: The manual calibration inputs have been completely removed. The script now uses a Statistical Normalization Engine. It calculates the 100-bar standard deviation of the MACD and turns the bar-to-bar delta into a standardized Z-Score.
The Result: A perfectly consistent, mathematically true angle (from -90° to +90°) that works flawlessly across all assets and all timeframes without needing manual tweaking.
2. Anti-Jitter Smoothing
Added a Delta Smoothing parameter (default: 3 EMA). This applies a slight smoothing to the raw MACD delta before it gets converted into an angle. This filters out the rapid bar-to-bar "flipping" caused by minor price wicks, giving you a much cleaner read on the actual trajectory of the trend.
3. New "Distance" Metric (MACD Histogram)
Added a dedicated column to show the exact distance between the MACD line and the Signal line (effectively the MACD Histogram value).
This metric is rounded to two decimal places and allows you to instantly monitor whether the gap on your higher timeframes is expanding or contracting, providing higher conviction for lower timeframe entries.
4. Streamlined & Compact UI
Reduced Screen Footprint: The dashboard has been highly optimized. We reduced the overall text size to size.small so it stops dominating your screen real estate.
Condensed Columns: The redundant "State" logic (ACCEL/DECEL) has been completely stripped out to optimize load times.
Smart Color Coding: The Cross and Zone columns have been elegantly merged. The table now simply displays PCO (Positive Cross Over) or NCO (Negative Cross Over). The text itself dynamically changes color—Green if the MACD is above the zero line, and Red if it is below.
릴리즈 노트
Added macd line difference between previous bar and current bar오픈 소스 스크립트
트레이딩뷰의 진정한 정신에 따라, 이 스크립트의 작성자는 이를 오픈소스로 공개하여 트레이더들이 기능을 검토하고 검증할 수 있도록 했습니다. 작성자에게 찬사를 보냅니다! 이 코드는 무료로 사용할 수 있지만, 코드를 재게시하는 경우 하우스 룰이 적용된다는 점을 기억하세요.

면책사항
해당 정보와 게시물은 금융, 투자, 트레이딩 또는 기타 유형의 조언이나 권장 사항으로 간주되지 않으며, 트레이딩뷰에서 제공하거나 보증하는 것이 아닙니다. 자세한 내용은 이용 약관을 참조하세요.
오픈 소스 스크립트
트레이딩뷰의 진정한 정신에 따라, 이 스크립트의 작성자는 이를 오픈소스로 공개하여 트레이더들이 기능을 검토하고 검증할 수 있도록 했습니다. 작성자에게 찬사를 보냅니다! 이 코드는 무료로 사용할 수 있지만, 코드를 재게시하는 경우 하우스 룰이 적용된다는 점을 기억하세요.
면책사항
해당 정보와 게시물은 금융, 투자, 트레이딩 또는 기타 유형의 조언이나 권장 사항으로 간주되지 않으며, 트레이딩뷰에서 제공하거나 보증하는 것이 아닙니다. 자세한 내용은 이용 약관을 참조하세요.