GannEdge Pro - Cycle Intelligence (FREE)
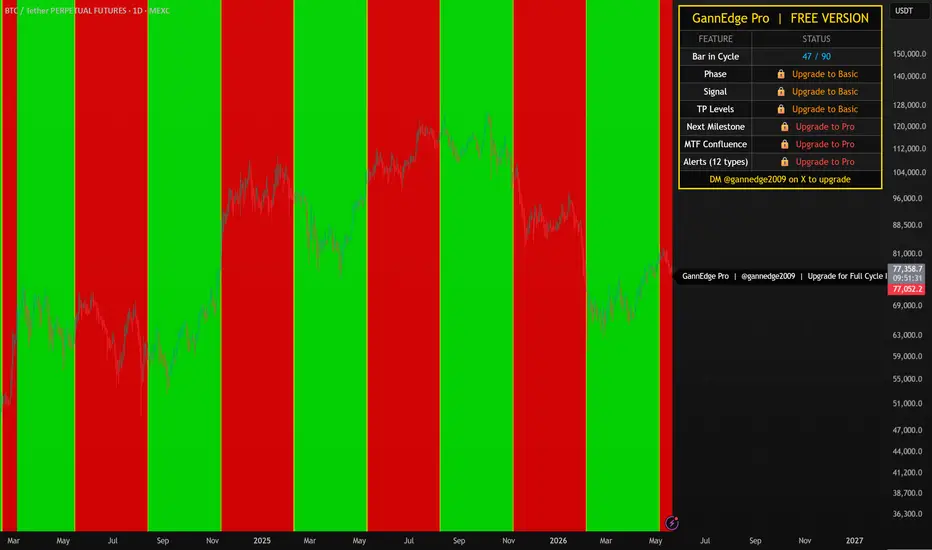
GannEdge Pro — Cycle Intelligence FREE
Identifies Gann cycle direction using highest high / lowest low anchoring.
🟢 GREEN background = Bullish cycle (from LOW)
🔴 RED background = Bearish cycle (from HIGH)
🟡 YELLOW bar = New cycle boundary — potential reversal zone
This is the FREE version. Upgrade to Basic or Pro for:
🔒 Phase labels (IMPULSE / CORRECTION / EXHAUSTION)
🔒 Signal labels (STRONG LONG / STRONG SHORT / CAUTION)
🔒 TP Levels on chart (TP1 / TP2 / TP3)
🔒 Next Milestone countdown with exact date & time
🔒 Multi-Timeframe Confluence panel
🔒 Trailing Stop Loss & Invalidation levels
🔒 12 alert types
DM @gannedge2009 on X to upgrade.
(c) GannEdgePro 2026 — All rights reserved.

If you can chart it, I have the answer. 🕐 The Clock Is Ticking...
면책사항
해당 정보와 게시물은 금융, 투자, 트레이딩 또는 기타 유형의 조언이나 권장 사항으로 간주되지 않으며, 트레이딩뷰에서 제공하거나 보증하는 것이 아닙니다. 자세한 내용은 이용 약관을 참조하세요.
If you can chart it, I have the answer. 🕐 The Clock Is Ticking...
면책사항
해당 정보와 게시물은 금융, 투자, 트레이딩 또는 기타 유형의 조언이나 권장 사항으로 간주되지 않으며, 트레이딩뷰에서 제공하거나 보증하는 것이 아닙니다. 자세한 내용은 이용 약관을 참조하세요.