Vishal Trades Support & Resistance
VISHAL TRADES SUPPORT & RESISTANCE ZONES
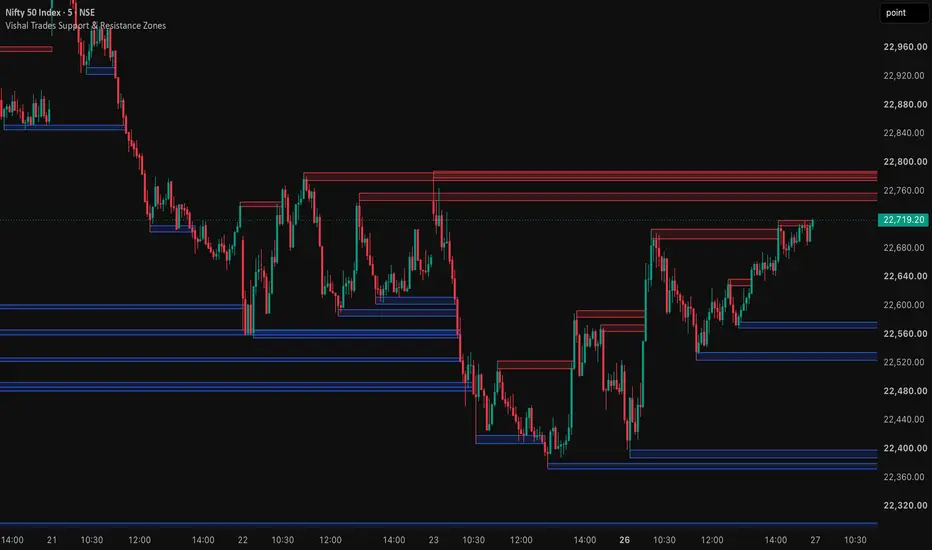
Vishal Trades Support & Resistance Zones automatically identifies potential support and resistance areas using confirmed swing highs and lows. It helps traders spot important price levels, anticipate potential market reactions, and plan entries and exits more effectively. Untested zones extend to the right until price breaks them.
KEY FEATURES
🔴 Red Zones: Potential resistance areas.
🔵 Blue Zones: Potential support areas.
➡️ Extended Zones: Untested zones continue extending to the right.
📊 Automatic Detection: Identifies zones using price action and swing points.
🎯 Breakout Tracking: Zones stop extending when price closes beyond their boundaries.
⏱️ Recommended Timeframes: Works best on 5-minute and 15-minute charts.
DISCLAIMER
This indicator is an analytical tool, not a guarantee of future price movements. Always use proper risk management.
Vishal Trades Support & Resistance Zones automatically identifies potential support and resistance areas using confirmed swing highs and lows. It helps traders spot important price levels, anticipate potential market reactions, and plan entries and exits more effectively. Untested zones extend to the right until price breaks them.
KEY FEATURES
🔴 Red Zones: Potential resistance areas.
🔵 Blue Zones: Potential support areas.
➡️ Extended Zones: Untested zones continue extending to the right.
📊 Automatic Detection: Identifies zones using price action and swing points.
🎯 Breakout Tracking: Zones stop extending when price closes beyond their boundaries.
⏱️ Recommended Timeframes: Works best on 5-minute and 15-minute charts.
DISCLAIMER
This indicator is an analytical tool, not a guarantee of future price movements. Always use proper risk management.

We Teach, You Trade.
youtube.com/@vishaltrades
youtube.com/@vishaltrades
면책사항
해당 정보와 게시물은 금융, 투자, 트레이딩 또는 기타 유형의 조언이나 권장 사항으로 간주되지 않으며, 트레이딩뷰에서 제공하거나 보증하는 것이 아닙니다. 자세한 내용은 이용 약관을 참조하세요.
We Teach, You Trade.
youtube.com/@vishaltrades
youtube.com/@vishaltrades
면책사항
해당 정보와 게시물은 금융, 투자, 트레이딩 또는 기타 유형의 조언이나 권장 사항으로 간주되지 않으며, 트레이딩뷰에서 제공하거나 보증하는 것이 아닙니다. 자세한 내용은 이용 약관을 참조하세요.