OPEN-SOURCE SCRIPT
Day-of-Week Effect
What the script does
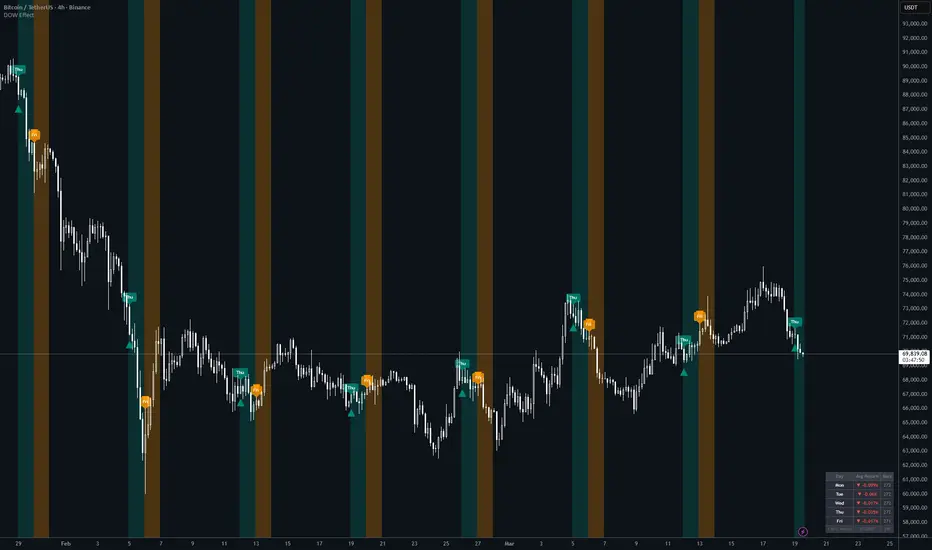
The Day-of-Week Effect indicator visualises a well-known market anomaly: certain days of the week produce statistically different average returns. The script identifies your chosen entry and exit days on any chart, highlights them visually, and calculates the historical average close-to-close return for every weekday — so you can see at a glance whether the effect actually holds on your chosen instrument.
How it works
On each bar, the script reads the day of the week using Pine Script's built-in dayofweek variable. It detects the first bar of each new trading day using ta.change(time("D")), which prevents signals from firing on every intraday bar if you're on a sub-daily timeframe. It then accumulates a running sum and count of close-to-close returns per weekday across the entire chart history, dividing them at the last bar to produce the average return table.
How to use it
Open TradingView, paste the script into the Pine Editor and click "Add to chart." The indicator works best on the 1D timeframe. In the Settings panel, toggle which days you want highlighted as entry days (teal) and exit days (orange)
Why it's original
Most DOW indicators simply colour-code days. This one goes further by pairing the visual highlighting with a live per-weekday return breakdown calculated directly from your chart's own price history — so rather than applying a generic market assumption, you're validating the effect on your specific ticker and timeframe before acting on it.
Alerts
The script does not currently include alertcondition() calls. To add alerts, you can extend the script with:
Pine Script®
The Day-of-Week Effect indicator visualises a well-known market anomaly: certain days of the week produce statistically different average returns. The script identifies your chosen entry and exit days on any chart, highlights them visually, and calculates the historical average close-to-close return for every weekday — so you can see at a glance whether the effect actually holds on your chosen instrument.
How it works
On each bar, the script reads the day of the week using Pine Script's built-in dayofweek variable. It detects the first bar of each new trading day using ta.change(time("D")), which prevents signals from firing on every intraday bar if you're on a sub-daily timeframe. It then accumulates a running sum and count of close-to-close returns per weekday across the entire chart history, dividing them at the last bar to produce the average return table.
How to use it
Open TradingView, paste the script into the Pine Editor and click "Add to chart." The indicator works best on the 1D timeframe. In the Settings panel, toggle which days you want highlighted as entry days (teal) and exit days (orange)
- Use the stats table in the bottom-right to identify which days have historically been strongest on your instrument
- Tthen configure your entry/exit days accordingly
- The display settings let you turn off labels, background shading, or the table independently
Why it's original
Most DOW indicators simply colour-code days. This one goes further by pairing the visual highlighting with a live per-weekday return breakdown calculated directly from your chart's own price history — so rather than applying a generic market assumption, you're validating the effect on your specific ticker and timeframe before acting on it.
Alerts
The script does not currently include alertcondition() calls. To add alerts, you can extend the script with:
오픈 소스 스크립트
트레이딩뷰의 진정한 정신에 따라, 이 스크립트의 작성자는 이를 오픈소스로 공개하여 트레이더들이 기능을 검토하고 검증할 수 있도록 했습니다. 작성자에게 찬사를 보냅니다! 이 코드는 무료로 사용할 수 있지만, 코드를 재게시하는 경우 하우스 룰이 적용된다는 점을 기억하세요.

면책사항
해당 정보와 게시물은 금융, 투자, 트레이딩 또는 기타 유형의 조언이나 권장 사항으로 간주되지 않으며, 트레이딩뷰에서 제공하거나 보증하는 것이 아닙니다. 자세한 내용은 이용 약관을 참조하세요.
오픈 소스 스크립트
트레이딩뷰의 진정한 정신에 따라, 이 스크립트의 작성자는 이를 오픈소스로 공개하여 트레이더들이 기능을 검토하고 검증할 수 있도록 했습니다. 작성자에게 찬사를 보냅니다! 이 코드는 무료로 사용할 수 있지만, 코드를 재게시하는 경우 하우스 룰이 적용된다는 점을 기억하세요.
면책사항
해당 정보와 게시물은 금융, 투자, 트레이딩 또는 기타 유형의 조언이나 권장 사항으로 간주되지 않으며, 트레이딩뷰에서 제공하거나 보증하는 것이 아닙니다. 자세한 내용은 이용 약관을 참조하세요.