OPEN-SOURCE SCRIPT
Precision Market Structure Pullback Toolkit [CLEVER]
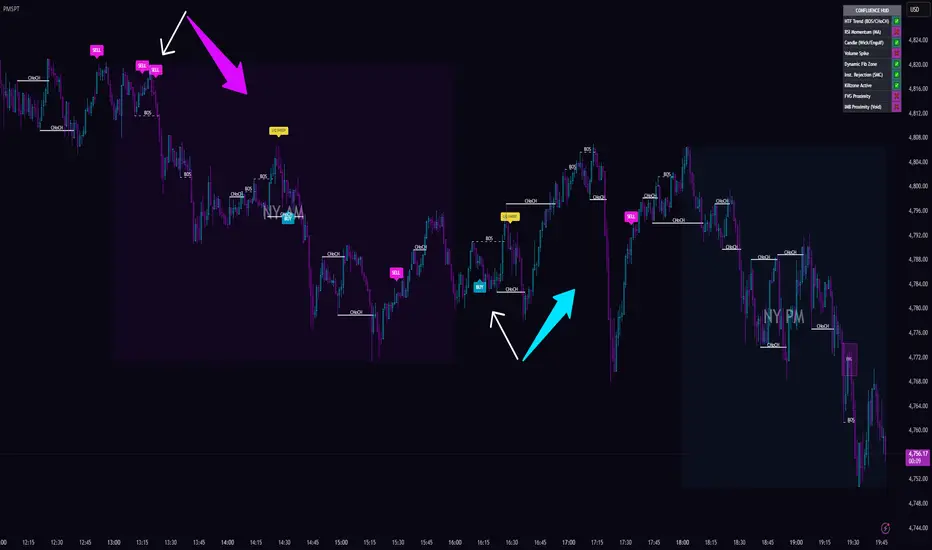
Overview: Precision Market Structure Pullback Toolkit [CLEVER]
The Precision Market Structure Pullback Toolkit [CLEVER] is a highly sophisticated TradingView indicator designed for traders who focus on Smart Money Concepts (SMC) and precision market timing. This tool combines multiple technical layers—ranging from candlestick patterns, RSI signals, liquidity sweeps, Fair Value Gaps (FVGs), and higher timeframe structure analysis—to identify high-probability pullback and reversal points in the market. Its design prioritizes educational and analytical purposes, making it suitable for both beginners learning market structure and professional traders looking for precise entries.
Getting Started
First, add the Precision Market Structure Pullback Toolkit [CLEVER] to your TradingView chart. Choose the timeframe based on your trading style: swing traders may prefer 1-hour, 4-hour, or daily charts, while intraday traders can use 5-minute, 15-minute, or 30-minute charts. Enable the higher timeframe (HTF) market structure view to display Break of Structure (BOS) and Change of Character (CHoCH) points on your chart. This helps you quickly understand the overall market direction.
Understanding Market Structure
Market structure is identified using BOS and CHoCH labels. A BOS indicates that the market trend is continuing, while a CHoCH signals a potential reversal or pullback. Always confirm using the higher timeframe so you trade in alignment with the main trend and avoid false signals.
Entry Signals
Pullback signals guide your entries. Aggressive traders can enter immediately after confirmation from RSI or candlestick patterns, while conservative traders may wait for multiple confirmations. Look for candlestick reactions around BOS and CHoCH zones, such as bullish or bearish engulfing, wick rejections, or strong body candles, which indicate high-probability entries.
Using FVG and Liquidity Sweeps
Combine pullback signals with Fair Value Gaps (FVGs) and liquidity sweeps for stronger entries. Liquidity sweeps show how price interacts with previous swing highs or lows. If price reacts to these zones, the probability of a successful trade increases. FVG zones indicate potential reversal or continuation areas; bullish FVG suggests an upward move, and bearish FVG suggests a downward move.
Confirmation with RSI and Volume
RSI and volume provide extra confirmation for your trades. RSI indicates momentum: for buys, it should rise from oversold or cross above the moving average; for sells, it should drop from overbought or below the moving average. Volume spikes often indicate institutional participation, increasing confidence in your entry.
Session and Key Zone Filters
Using session and key zone filters improves trade quality. Enter trades only during active trading sessions, such as the London-New York overlap for Forex or high-volume periods for indices and commodities. Avoid trading during low-liquidity periods when price action may be unstable.
Trade Execution
Enter trades near BOS, CHoCH, or FVG zones, after confirming with candlestick patterns, RSI, and liquidity sweeps. Place your stop-loss below/above the recent swing low/high or near liquidity sweep zones. Take profit at the next BOS, structural level, or FVG target. The built-in dashboard displays market structure, active FVG zones, RSI, and session activity, helping you make faster and more confident decisions.
Best Practices
Always trade in the direction of the higher timeframe trend. Use multiple confirmations (structure, FVG, candlesticks, RSI, volume) to increase the probability of success. Beginners should start in conservative mode to fully understand the indicator’s signals before taking aggressive trades.
Market Structure Detection
The indicator first analyzes the chart to detect market structure. It identifies key points called Break of Structure (BOS) and Change of Character (CHoCH) using price swings on the current and higher timeframe. A BOS indicates the continuation of the current trend, while a CHoCH signals a possible reversal or pullback. This forms the backbone of all trade signals, ensuring trades align with the overall market trend.
Pullback and Entry Identification
Once market structure is established, the script looks for pullbacks into significant zones such as recent swing highs/lows, FVGs, or liquidity sweeps. These pullbacks act as potential entry points. The indicator provides two modes: a conservative mode, which waits for multiple confirmations, and an aggressive early entry mode, which triggers signals faster for high-volatility markets like XAUUSD.
Candlestick and Wick Analysis
The toolkit uses candlestick patterns, wick rejections, and strong body candles to confirm entries. Bullish signals are triggered when price shows strong upward rejection or engulfing patterns at support zones. Bearish signals occur when price shows downward rejection or bearish engulfing at resistance zones. This ensures entries have high probability and are not random.
RSI and Momentum Confirmation
The Relative Strength Index (RSI) is used as a momentum filter. Buy signals are stronger when RSI rises from oversold levels or crosses above its moving average. Sell signals are confirmed when RSI falls from overbought levels or crosses below its moving average. This adds a dynamic layer to ensure trades move with momentum rather than against it.
Volume Spike Verification
Volume analysis acts as an institutional confirmation filter. Large volume spikes indicate that major market players are active, confirming the validity of the pullback or breakout. This prevents entering trades during low-volume, high-risk periods and improves the accuracy of signals.
Fair Value Gap (FVG) and Imbalance Detection
The script identifies Fair Value Gaps (FVGs), which are price areas left unfilled by strong moves. Bullish FVGs highlight potential support for upward reversals, while bearish FVGs highlight potential resistance for downward moves. Similarly, volume imbalances (IMBs) are detected where price jumps between candles, often signaling institutional activity. Both FVGs and IMBs improve timing and probability of successful trades.
Liquidity Sweep Mechanics
The toolkit detects liquidity sweeps, where price temporarily breaches previous swing highs or lows to trigger stop-hunts or institutional liquidity collection. The indicator flags these sweeps, and if price reacts with a wick rejection or strong candle, it confirms a high-probability entry in the direction of the main trend.
Session and Killzone Filters
Trades are filtered by active market sessions, like the London-New York overlap, and key killzones for Forex. This ensures signals are only considered during periods of high liquidity and volatility, reducing the likelihood of false signals during slow or illiquid sessions.
Final Signal Generation
All these elements—market structure, pullbacks, candlestick confirmation, RSI momentum, volume spikes, FVGs, liquidity sweeps, and session filters—are combined to generate buy or sell signals. The indicator also provides visual labels, lines, and a dashboard for real-time confluence, helping traders make decisions quickly and confidently.
Key Features of Precision Market Structure Pullback Toolkit [CLEVER]
Market Structure Alerts
The indicator automatically identifies Break of Structure (BOS) and Change of Character (CHoCH) points, highlighting trend continuation and potential reversals. Traders can align entries with the dominant market trend without manually tracking swings.
Pullback Detection
It spots high-probability pullback zones using swing highs/lows, Fair Value Gaps (FVGs), and liquidity zones. Visual alerts appear when price retraces into these zones, offering optimal entry opportunities with reduced risk.
Candlestick Confirmation
The toolkit analyzes candlestick patterns and wick rejections to validate entries. Signals are reinforced when bullish or bearish candles coincide with pullback zones, ensuring trades are supported by price action, not just technical levels.
Momentum & RSI Filters
Integrated RSI and momentum checks confirm that trades follow the market’s energy. Buy entries are stronger during oversold reversals, while sell entries align with overbought conditions, adding an extra layer of precision to each signal.
Volume & Institutional Activity
The indicator tracks volume spikes and imbalances, identifying areas where institutional traders are likely active. This helps avoid low-probability trades and confirms the strength behind moves, especially during breakouts and liquidity sweeps.
Fair Value Gap & Imbalance Recognition
Bullish and bearish FVGs highlight potential support and resistance zones created by price inefficiencies. Detecting these gaps improves timing for entering trades and catching reversals or trend continuations.
Liquidity Sweep Alerts
It identifies liquidity sweeps, such as stop-hunts, that often precede strong market moves. Visual cues indicate when price has cleared liquidity and is likely to resume in the main trend direction, giving traders advanced warning.
Session & Killzone Filtering
Signals can be filtered based on market sessions (London or New York) and key Forex killzones. This ensures trades are executed during periods of high liquidity and volatility, reducing false signals during quiet market hours.
Visual Dashboard & Labeling
All signals, zones, and key levels are displayed on the chart with labels, lines, and color-coded markers. A real-time dashboard provides an overview of trend direction, pullbacks, and active signals, making it easy for traders to interpret market conditions at a glance.
Settings & Customization
The Precision Market Structure Pullback Toolkit [CLEVER] offers a wide range of customizable settings to suit different trading styles and timeframes. Traders can enable or disable Early Entry Mode, allowing signals to trigger aggressively based on either candlestick patterns or RSI confirmation. RSI settings are fully adjustable, including length, moving average period, signal mode, and buy/sell zone thresholds.
For trend alignment, the indicator supports Higher Timeframe (HTF) analysis, including configurable HTF lookback length, optional 50 EMA trend confirmation, and visual display of BOS/CHoCH on the chart. Users can also filter signals using Fibonacci retracement zones, with customizable pivot strength, retracement levels, and strictness of FVG confirmation.
Volume and session filters allow traders to restrict signals to London/New York overlap sessions or significant volume spikes, improving signal quality during active market hours. The Session Killzone feature provides color-coded boxes for Asian, London, and New York sessions, with options to show labels, extend high/low lines, and require active sessions for valid signals.
Advanced options include Institutional Rejection Filters, wick rejection ratios, and liquidity sweep detection, allowing traders to fine-tune how conservative or aggressive the system should be. Fair Value Gaps (FVGs) and Volume Imbalances (IMBs) can be shown or hidden, with limits on how many to display and settings for minimum size and body displacement.
Finally, a real-time dashboard (HUD) can be positioned anywhere on the chart, with customizable colors, providing a quick visual overview of trend direction, pullbacks, and active confluence zones. This level of customization ensures the toolkit adapts to multiple markets, instruments, and trading strategies.
Multi-Layered Entry Logic
The PMSPT indicator incorporates a multi-step entry system. Traders can choose between standard entries, which require confirmation from both RSI signals and candlestick patterns, or an early entry mode, which triggers trades as soon as either confirmation occurs. This dual approach allows users to adapt to different market conditions—aggressive traders can capture fast moves in instruments like XAUUSD, while conservative traders can wait for full confirmation to reduce risk. The RSI module provides flexible options, including simple directional checks or RSI-MA crossovers, with customizable zones for buy and sell signals.
Higher Timeframe Confirmation
A critical feature of PMSPT is its Higher Timeframe Market Structure detection, including Break of Structure (BOS) and Change of Character (CHoCH). Using pivot highs and lows along with optional 50 EMA trend confirmation, the indicator determines whether the market is trending bullish or bearish on higher timeframes. Traders can filter for only strong structural moves that align with volume spikes and candlestick strength, improving the probability of entering in the direction of institutional activity. Visual lines and labels mark these structural points directly on the chart, making trend context easy to interpret at a glance.
Candlestick & Liquidity Filters
The toolkit detects candlestick patterns such as bullish/bearish engulfing, strong body candles, and wick rejections, integrating them into a liquidity-aware framework. By combining these patterns with Liquidity Sweep detection—where price tests and rejects prior swing levels—the indicator filters out false breakouts and ensures trades are aligned with institutional order flow. Users can enable filters that only allow entries when liquidity sweeps or wick rejections confirm market intent, reducing high-risk trades.
Fibonacci & Confluence Analysis
PMSPT includes a dynamic Fibonacci retracement module, which calculates retracement levels based on recent swings in the market. Traders can enable the Fibonacci filter to only take entries that coincide with high-probability zones, adding another layer of confluence to the strategy. This ensures pullback entries occur near logical support/resistance levels, increasing the likelihood of a successful trade.
Fair Value Gaps (FVG) and Imbalance Detection
A standout feature of the toolkit is its Fair Value Gap (FVG) and Volume Imbalance (IMB) detection system. The indicator identifies bullish and bearish gaps in price where market inefficiencies exist, marking them visually with customizable colors and labels. Mitigation logic ensures that once these gaps are filled, they are removed from the chart, keeping it uncluttered. Additionally, volume imbalances are highlighted, allowing traders to spot areas where price may react due to supply/demand discrepancies.
Session & Volume Filters
To enhance precision, PMSPT offers session filters for London, New York, and Asian market overlaps, as well as volume spike confirmation. Traders can activate killzones, which highlight active trading windows, and further refine entries by requiring signals to align with session activity. Volume multipliers ensure that entries are only considered when sufficient market participation occurs, avoiding low-liquidity traps.
Dashboard & Display Features
The confluence dashboard (HUD) provides a real-time visual overview of multiple signals, including structure, RSI, FVGs, and imbalances. Users can position the HUD in any corner of the chart and customize its appearance. Additionally, signals, BOS/CHoCH markers, FVGs, IMBs, and session zones are all visually displayed with user-defined colors, making it easy to monitor market conditions without constant numerical analysis.
Summary
In essence, the Precision Market Structure Pullback Toolkit [CLEVER] is a professional-grade indicator that integrates SMC concepts, technical analysis, and institutional order flow filters to provide actionable insights. Its flexibility and depth make it suitable for both learning and live trading, with multiple layers of confirmation ensuring trades are aligned with market momentum and liquidity. By combining candlestick patterns, RSI, FVGs, liquidity sweeps, higher timeframe structure, and session-based filters, PMSPT empowers traders to identify high-probability pullbacks and breakout opportunities with clarity and precision.
Disclaimer
The Precision Market Structure Pullback Toolkit [CLEVER] is designed for educational and informational purposes only. It does not constitute financial advice or a recommendation to buy or sell any financial instrument. Trading inherently carries a high level of risk, including the potential loss of invested capital, and past performance is not indicative of future results. Users are strongly encouraged to conduct their own research, verify all signals, and consult with a licensed financial advisor before making any trading decisions. The developer and publisher of this indicator are not responsible for any losses or damages that may occur from the use of this toolkit. It is recommended to use proper risk management and practice on demo accounts before deploying strategies in live markets.
The Precision Market Structure Pullback Toolkit [CLEVER] is a highly sophisticated TradingView indicator designed for traders who focus on Smart Money Concepts (SMC) and precision market timing. This tool combines multiple technical layers—ranging from candlestick patterns, RSI signals, liquidity sweeps, Fair Value Gaps (FVGs), and higher timeframe structure analysis—to identify high-probability pullback and reversal points in the market. Its design prioritizes educational and analytical purposes, making it suitable for both beginners learning market structure and professional traders looking for precise entries.
Getting Started
First, add the Precision Market Structure Pullback Toolkit [CLEVER] to your TradingView chart. Choose the timeframe based on your trading style: swing traders may prefer 1-hour, 4-hour, or daily charts, while intraday traders can use 5-minute, 15-minute, or 30-minute charts. Enable the higher timeframe (HTF) market structure view to display Break of Structure (BOS) and Change of Character (CHoCH) points on your chart. This helps you quickly understand the overall market direction.
Understanding Market Structure
Market structure is identified using BOS and CHoCH labels. A BOS indicates that the market trend is continuing, while a CHoCH signals a potential reversal or pullback. Always confirm using the higher timeframe so you trade in alignment with the main trend and avoid false signals.
Entry Signals
Pullback signals guide your entries. Aggressive traders can enter immediately after confirmation from RSI or candlestick patterns, while conservative traders may wait for multiple confirmations. Look for candlestick reactions around BOS and CHoCH zones, such as bullish or bearish engulfing, wick rejections, or strong body candles, which indicate high-probability entries.
Using FVG and Liquidity Sweeps
Combine pullback signals with Fair Value Gaps (FVGs) and liquidity sweeps for stronger entries. Liquidity sweeps show how price interacts with previous swing highs or lows. If price reacts to these zones, the probability of a successful trade increases. FVG zones indicate potential reversal or continuation areas; bullish FVG suggests an upward move, and bearish FVG suggests a downward move.
Confirmation with RSI and Volume
RSI and volume provide extra confirmation for your trades. RSI indicates momentum: for buys, it should rise from oversold or cross above the moving average; for sells, it should drop from overbought or below the moving average. Volume spikes often indicate institutional participation, increasing confidence in your entry.
Session and Key Zone Filters
Using session and key zone filters improves trade quality. Enter trades only during active trading sessions, such as the London-New York overlap for Forex or high-volume periods for indices and commodities. Avoid trading during low-liquidity periods when price action may be unstable.
Trade Execution
Enter trades near BOS, CHoCH, or FVG zones, after confirming with candlestick patterns, RSI, and liquidity sweeps. Place your stop-loss below/above the recent swing low/high or near liquidity sweep zones. Take profit at the next BOS, structural level, or FVG target. The built-in dashboard displays market structure, active FVG zones, RSI, and session activity, helping you make faster and more confident decisions.
Best Practices
Always trade in the direction of the higher timeframe trend. Use multiple confirmations (structure, FVG, candlesticks, RSI, volume) to increase the probability of success. Beginners should start in conservative mode to fully understand the indicator’s signals before taking aggressive trades.
Market Structure Detection
The indicator first analyzes the chart to detect market structure. It identifies key points called Break of Structure (BOS) and Change of Character (CHoCH) using price swings on the current and higher timeframe. A BOS indicates the continuation of the current trend, while a CHoCH signals a possible reversal or pullback. This forms the backbone of all trade signals, ensuring trades align with the overall market trend.
Pullback and Entry Identification
Once market structure is established, the script looks for pullbacks into significant zones such as recent swing highs/lows, FVGs, or liquidity sweeps. These pullbacks act as potential entry points. The indicator provides two modes: a conservative mode, which waits for multiple confirmations, and an aggressive early entry mode, which triggers signals faster for high-volatility markets like XAUUSD.
Candlestick and Wick Analysis
The toolkit uses candlestick patterns, wick rejections, and strong body candles to confirm entries. Bullish signals are triggered when price shows strong upward rejection or engulfing patterns at support zones. Bearish signals occur when price shows downward rejection or bearish engulfing at resistance zones. This ensures entries have high probability and are not random.
RSI and Momentum Confirmation
The Relative Strength Index (RSI) is used as a momentum filter. Buy signals are stronger when RSI rises from oversold levels or crosses above its moving average. Sell signals are confirmed when RSI falls from overbought levels or crosses below its moving average. This adds a dynamic layer to ensure trades move with momentum rather than against it.
Volume Spike Verification
Volume analysis acts as an institutional confirmation filter. Large volume spikes indicate that major market players are active, confirming the validity of the pullback or breakout. This prevents entering trades during low-volume, high-risk periods and improves the accuracy of signals.
Fair Value Gap (FVG) and Imbalance Detection
The script identifies Fair Value Gaps (FVGs), which are price areas left unfilled by strong moves. Bullish FVGs highlight potential support for upward reversals, while bearish FVGs highlight potential resistance for downward moves. Similarly, volume imbalances (IMBs) are detected where price jumps between candles, often signaling institutional activity. Both FVGs and IMBs improve timing and probability of successful trades.
Liquidity Sweep Mechanics
The toolkit detects liquidity sweeps, where price temporarily breaches previous swing highs or lows to trigger stop-hunts or institutional liquidity collection. The indicator flags these sweeps, and if price reacts with a wick rejection or strong candle, it confirms a high-probability entry in the direction of the main trend.
Session and Killzone Filters
Trades are filtered by active market sessions, like the London-New York overlap, and key killzones for Forex. This ensures signals are only considered during periods of high liquidity and volatility, reducing the likelihood of false signals during slow or illiquid sessions.
Final Signal Generation
All these elements—market structure, pullbacks, candlestick confirmation, RSI momentum, volume spikes, FVGs, liquidity sweeps, and session filters—are combined to generate buy or sell signals. The indicator also provides visual labels, lines, and a dashboard for real-time confluence, helping traders make decisions quickly and confidently.
Key Features of Precision Market Structure Pullback Toolkit [CLEVER]
Market Structure Alerts
The indicator automatically identifies Break of Structure (BOS) and Change of Character (CHoCH) points, highlighting trend continuation and potential reversals. Traders can align entries with the dominant market trend without manually tracking swings.
Pullback Detection
It spots high-probability pullback zones using swing highs/lows, Fair Value Gaps (FVGs), and liquidity zones. Visual alerts appear when price retraces into these zones, offering optimal entry opportunities with reduced risk.
Candlestick Confirmation
The toolkit analyzes candlestick patterns and wick rejections to validate entries. Signals are reinforced when bullish or bearish candles coincide with pullback zones, ensuring trades are supported by price action, not just technical levels.
Momentum & RSI Filters
Integrated RSI and momentum checks confirm that trades follow the market’s energy. Buy entries are stronger during oversold reversals, while sell entries align with overbought conditions, adding an extra layer of precision to each signal.
Volume & Institutional Activity
The indicator tracks volume spikes and imbalances, identifying areas where institutional traders are likely active. This helps avoid low-probability trades and confirms the strength behind moves, especially during breakouts and liquidity sweeps.
Fair Value Gap & Imbalance Recognition
Bullish and bearish FVGs highlight potential support and resistance zones created by price inefficiencies. Detecting these gaps improves timing for entering trades and catching reversals or trend continuations.
Liquidity Sweep Alerts
It identifies liquidity sweeps, such as stop-hunts, that often precede strong market moves. Visual cues indicate when price has cleared liquidity and is likely to resume in the main trend direction, giving traders advanced warning.
Session & Killzone Filtering
Signals can be filtered based on market sessions (London or New York) and key Forex killzones. This ensures trades are executed during periods of high liquidity and volatility, reducing false signals during quiet market hours.
Visual Dashboard & Labeling
All signals, zones, and key levels are displayed on the chart with labels, lines, and color-coded markers. A real-time dashboard provides an overview of trend direction, pullbacks, and active signals, making it easy for traders to interpret market conditions at a glance.
Settings & Customization
The Precision Market Structure Pullback Toolkit [CLEVER] offers a wide range of customizable settings to suit different trading styles and timeframes. Traders can enable or disable Early Entry Mode, allowing signals to trigger aggressively based on either candlestick patterns or RSI confirmation. RSI settings are fully adjustable, including length, moving average period, signal mode, and buy/sell zone thresholds.
For trend alignment, the indicator supports Higher Timeframe (HTF) analysis, including configurable HTF lookback length, optional 50 EMA trend confirmation, and visual display of BOS/CHoCH on the chart. Users can also filter signals using Fibonacci retracement zones, with customizable pivot strength, retracement levels, and strictness of FVG confirmation.
Volume and session filters allow traders to restrict signals to London/New York overlap sessions or significant volume spikes, improving signal quality during active market hours. The Session Killzone feature provides color-coded boxes for Asian, London, and New York sessions, with options to show labels, extend high/low lines, and require active sessions for valid signals.
Advanced options include Institutional Rejection Filters, wick rejection ratios, and liquidity sweep detection, allowing traders to fine-tune how conservative or aggressive the system should be. Fair Value Gaps (FVGs) and Volume Imbalances (IMBs) can be shown or hidden, with limits on how many to display and settings for minimum size and body displacement.
Finally, a real-time dashboard (HUD) can be positioned anywhere on the chart, with customizable colors, providing a quick visual overview of trend direction, pullbacks, and active confluence zones. This level of customization ensures the toolkit adapts to multiple markets, instruments, and trading strategies.
Multi-Layered Entry Logic
The PMSPT indicator incorporates a multi-step entry system. Traders can choose between standard entries, which require confirmation from both RSI signals and candlestick patterns, or an early entry mode, which triggers trades as soon as either confirmation occurs. This dual approach allows users to adapt to different market conditions—aggressive traders can capture fast moves in instruments like XAUUSD, while conservative traders can wait for full confirmation to reduce risk. The RSI module provides flexible options, including simple directional checks or RSI-MA crossovers, with customizable zones for buy and sell signals.
Higher Timeframe Confirmation
A critical feature of PMSPT is its Higher Timeframe Market Structure detection, including Break of Structure (BOS) and Change of Character (CHoCH). Using pivot highs and lows along with optional 50 EMA trend confirmation, the indicator determines whether the market is trending bullish or bearish on higher timeframes. Traders can filter for only strong structural moves that align with volume spikes and candlestick strength, improving the probability of entering in the direction of institutional activity. Visual lines and labels mark these structural points directly on the chart, making trend context easy to interpret at a glance.
Candlestick & Liquidity Filters
The toolkit detects candlestick patterns such as bullish/bearish engulfing, strong body candles, and wick rejections, integrating them into a liquidity-aware framework. By combining these patterns with Liquidity Sweep detection—where price tests and rejects prior swing levels—the indicator filters out false breakouts and ensures trades are aligned with institutional order flow. Users can enable filters that only allow entries when liquidity sweeps or wick rejections confirm market intent, reducing high-risk trades.
Fibonacci & Confluence Analysis
PMSPT includes a dynamic Fibonacci retracement module, which calculates retracement levels based on recent swings in the market. Traders can enable the Fibonacci filter to only take entries that coincide with high-probability zones, adding another layer of confluence to the strategy. This ensures pullback entries occur near logical support/resistance levels, increasing the likelihood of a successful trade.
Fair Value Gaps (FVG) and Imbalance Detection
A standout feature of the toolkit is its Fair Value Gap (FVG) and Volume Imbalance (IMB) detection system. The indicator identifies bullish and bearish gaps in price where market inefficiencies exist, marking them visually with customizable colors and labels. Mitigation logic ensures that once these gaps are filled, they are removed from the chart, keeping it uncluttered. Additionally, volume imbalances are highlighted, allowing traders to spot areas where price may react due to supply/demand discrepancies.
Session & Volume Filters
To enhance precision, PMSPT offers session filters for London, New York, and Asian market overlaps, as well as volume spike confirmation. Traders can activate killzones, which highlight active trading windows, and further refine entries by requiring signals to align with session activity. Volume multipliers ensure that entries are only considered when sufficient market participation occurs, avoiding low-liquidity traps.
Dashboard & Display Features
The confluence dashboard (HUD) provides a real-time visual overview of multiple signals, including structure, RSI, FVGs, and imbalances. Users can position the HUD in any corner of the chart and customize its appearance. Additionally, signals, BOS/CHoCH markers, FVGs, IMBs, and session zones are all visually displayed with user-defined colors, making it easy to monitor market conditions without constant numerical analysis.
Summary
In essence, the Precision Market Structure Pullback Toolkit [CLEVER] is a professional-grade indicator that integrates SMC concepts, technical analysis, and institutional order flow filters to provide actionable insights. Its flexibility and depth make it suitable for both learning and live trading, with multiple layers of confirmation ensuring trades are aligned with market momentum and liquidity. By combining candlestick patterns, RSI, FVGs, liquidity sweeps, higher timeframe structure, and session-based filters, PMSPT empowers traders to identify high-probability pullbacks and breakout opportunities with clarity and precision.
Disclaimer
The Precision Market Structure Pullback Toolkit [CLEVER] is designed for educational and informational purposes only. It does not constitute financial advice or a recommendation to buy or sell any financial instrument. Trading inherently carries a high level of risk, including the potential loss of invested capital, and past performance is not indicative of future results. Users are strongly encouraged to conduct their own research, verify all signals, and consult with a licensed financial advisor before making any trading decisions. The developer and publisher of this indicator are not responsible for any losses or damages that may occur from the use of this toolkit. It is recommended to use proper risk management and practice on demo accounts before deploying strategies in live markets.
오픈 소스 스크립트
트레이딩뷰의 진정한 정신에 따라, 이 스크립트의 작성자는 이를 오픈소스로 공개하여 트레이더들이 기능을 검토하고 검증할 수 있도록 했습니다. 작성자에게 찬사를 보냅니다! 이 코드는 무료로 사용할 수 있지만, 코드를 재게시하는 경우 하우스 룰이 적용된다는 점을 기억하세요.

면책사항
해당 정보와 게시물은 금융, 투자, 트레이딩 또는 기타 유형의 조언이나 권장 사항으로 간주되지 않으며, 트레이딩뷰에서 제공하거나 보증하는 것이 아닙니다. 자세한 내용은 이용 약관을 참조하세요.
오픈 소스 스크립트
트레이딩뷰의 진정한 정신에 따라, 이 스크립트의 작성자는 이를 오픈소스로 공개하여 트레이더들이 기능을 검토하고 검증할 수 있도록 했습니다. 작성자에게 찬사를 보냅니다! 이 코드는 무료로 사용할 수 있지만, 코드를 재게시하는 경우 하우스 룰이 적용된다는 점을 기억하세요.
면책사항
해당 정보와 게시물은 금융, 투자, 트레이딩 또는 기타 유형의 조언이나 권장 사항으로 간주되지 않으며, 트레이딩뷰에서 제공하거나 보증하는 것이 아닙니다. 자세한 내용은 이용 약관을 참조하세요.