OPEN-SOURCE SCRIPT
Time of Day Levels
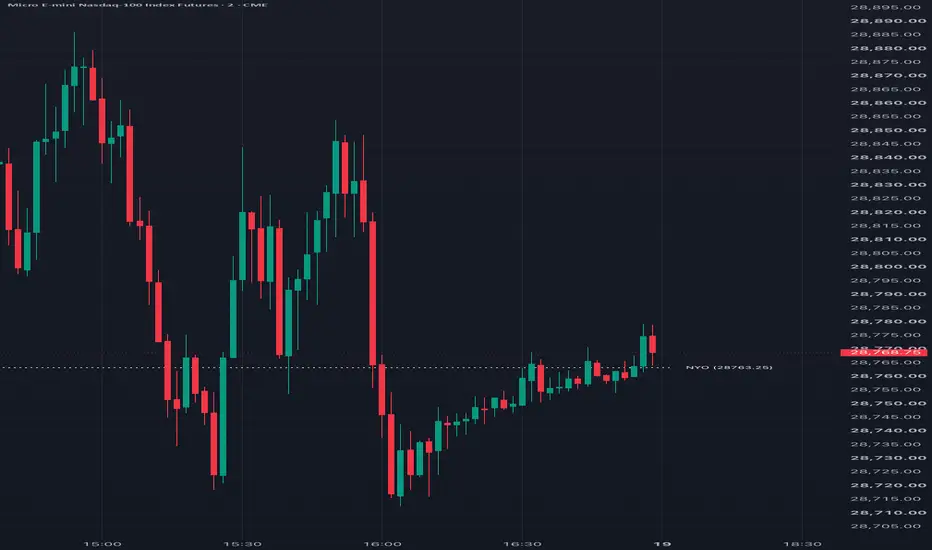
This is an indicator to plot a level that corresponds to a particular time of day (hour and minute) and draw that level as a horizontal line, with text tag, as far through the rest of the day as desired. It is common to plot midnight open and cash market open as levels, but this will give you the ability to plot for other times as well, useful for some trading strategies.
The historically difficult thing to do has been plotting for times that fall in the middle of a time bar, like if you wanted to plot the level for 9:53 on a 5 minute chart. When the level does not correspond to beginning or end of a chart's bar, the code will look back up to 15 minutes into the middle of the bar to find the level. So, it will work will for time bars up to 15 minutes, but may not show the level for larger time bars.
Note: This has not been tested for charts that don't use fixed time bars
For up to 10 time levels, you can specify the following:
For the text tags, you can specify the following:
In Other Settings, you can also force the times to be interpreted as Eastern Standard Time, accounting for daylight savings. Otherwise, local chart time will be used
The historically difficult thing to do has been plotting for times that fall in the middle of a time bar, like if you wanted to plot the level for 9:53 on a 5 minute chart. When the level does not correspond to beginning or end of a chart's bar, the code will look back up to 15 minutes into the middle of the bar to find the level. So, it will work will for time bars up to 15 minutes, but may not show the level for larger time bars.
Note: This has not been tested for charts that don't use fixed time bars
For up to 10 time levels, you can specify the following:
- Hour: An integer specifying the desired hour in 24 hour format
- Minute: An integer specifying the desired minute in that hour
- Use Close: If checked will spot the closing value of the specified 1 minute time, otherwise will show the opening value
- Tag Text: Text to show to the right of the horizontal line plots for the time level
- Extend Minutes: How long, in minutes, to extend the line from the specified time. If set to 0 or 1440, the line will just always be updated to the current day
- Color - Style - Width: Specifies the style for the plotted horizontal line
For the text tags, you can specify the following:
- Color: The color for all text tags, unless choosing to use the individual line colors
- Size: Size of text tags
- Offset: The number of bars to the right of the plotted horizontal line before showing the text tag. A value of 0 will place it right next to the horizontal line
- Use Line Color: Instead of using the Text Tag Color, text tags will be drawn in the same color as the horizontal line
- Show Level: When checked, the price level will be printed to the right of the text tag in parentheses
In Other Settings, you can also force the times to be interpreted as Eastern Standard Time, accounting for daylight savings. Otherwise, local chart time will be used
오픈 소스 스크립트
트레이딩뷰의 진정한 정신에 따라, 이 스크립트의 작성자는 이를 오픈소스로 공개하여 트레이더들이 기능을 검토하고 검증할 수 있도록 했습니다. 작성자에게 찬사를 보냅니다! 이 코드는 무료로 사용할 수 있지만, 코드를 재게시하는 경우 하우스 룰이 적용된다는 점을 기억하세요.

면책사항
해당 정보와 게시물은 금융, 투자, 트레이딩 또는 기타 유형의 조언이나 권장 사항으로 간주되지 않으며, 트레이딩뷰에서 제공하거나 보증하는 것이 아닙니다. 자세한 내용은 이용 약관을 참조하세요.
오픈 소스 스크립트
트레이딩뷰의 진정한 정신에 따라, 이 스크립트의 작성자는 이를 오픈소스로 공개하여 트레이더들이 기능을 검토하고 검증할 수 있도록 했습니다. 작성자에게 찬사를 보냅니다! 이 코드는 무료로 사용할 수 있지만, 코드를 재게시하는 경우 하우스 룰이 적용된다는 점을 기억하세요.
면책사항
해당 정보와 게시물은 금융, 투자, 트레이딩 또는 기타 유형의 조언이나 권장 사항으로 간주되지 않으며, 트레이딩뷰에서 제공하거나 보증하는 것이 아닙니다. 자세한 내용은 이용 약관을 참조하세요.