Win Rate With Its Error Bar (Wilson 95%)
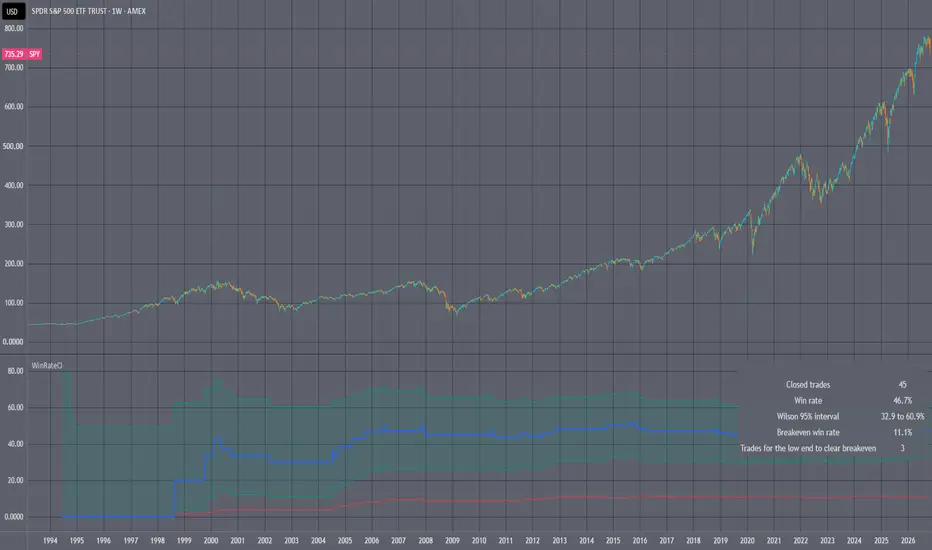
A win rate is a measurement, and a measurement on a few dozen trades has an error bar that strategy reports don't print. This script puts it on the chart.
It trades one deliberately dull rule bar by bar: long when the close crosses above a simple moving average, out when it crosses back below, measured at the signal bar's close with no commissions or slippage. Every closed trade counts as a win or a loss, and a flat exit counts as a loss.
Blue is the running win rate. The teal band is its Wilson 95% score interval. Red is the breakeven win rate implied by the rule's own payoff so far, 1 / (1 + average win / average loss), or a fixed value you choose.
Two things worth watching. The band narrows slowly: halving its width takes roughly four times the trades, because it shrinks with the square root of the count. And the question that matters is not where the blue line is but whether the bottom of the band has cleared the red one. The table shows the closed-trade count, the interval, and how many trades the current win rate would need before the lower end clears breakeven.
Open source so you can swap in your own rule and watch the same arithmetic. Arithmetic on your chart, not a result of mine. Nothing here is investment advice.
It trades one deliberately dull rule bar by bar: long when the close crosses above a simple moving average, out when it crosses back below, measured at the signal bar's close with no commissions or slippage. Every closed trade counts as a win or a loss, and a flat exit counts as a loss.
Blue is the running win rate. The teal band is its Wilson 95% score interval. Red is the breakeven win rate implied by the rule's own payoff so far, 1 / (1 + average win / average loss), or a fixed value you choose.
Two things worth watching. The band narrows slowly: halving its width takes roughly four times the trades, because it shrinks with the square root of the count. And the question that matters is not where the blue line is but whether the bottom of the band has cleared the red one. The table shows the closed-trade count, the interval, and how many trades the current win rate would need before the lower end clears breakeven.
Open source so you can swap in your own rule and watch the same arithmetic. Arithmetic on your chart, not a result of mine. Nothing here is investment advice.

Ten checks before you believe a backtest — the free one-page checklist: quanticator.app/tv · No-repaint HTF Template Pack (Pine v6, $39): jordonharrell.gumroad.com/l/norepaint-htf-template-pack
면책사항
해당 정보와 게시물은 금융, 투자, 트레이딩 또는 기타 유형의 조언이나 권장 사항으로 간주되지 않으며, 트레이딩뷰에서 제공하거나 보증하는 것이 아닙니다. 자세한 내용은 이용 약관을 참조하세요.
Ten checks before you believe a backtest — the free one-page checklist: quanticator.app/tv · No-repaint HTF Template Pack (Pine v6, $39): jordonharrell.gumroad.com/l/norepaint-htf-template-pack
면책사항
해당 정보와 게시물은 금융, 투자, 트레이딩 또는 기타 유형의 조언이나 권장 사항으로 간주되지 않으며, 트레이딩뷰에서 제공하거나 보증하는 것이 아닙니다. 자세한 내용은 이용 약관을 참조하세요.