OPEN-SOURCE SCRIPT
업데이트됨 Impulse RSI - TobbySimard
Overview
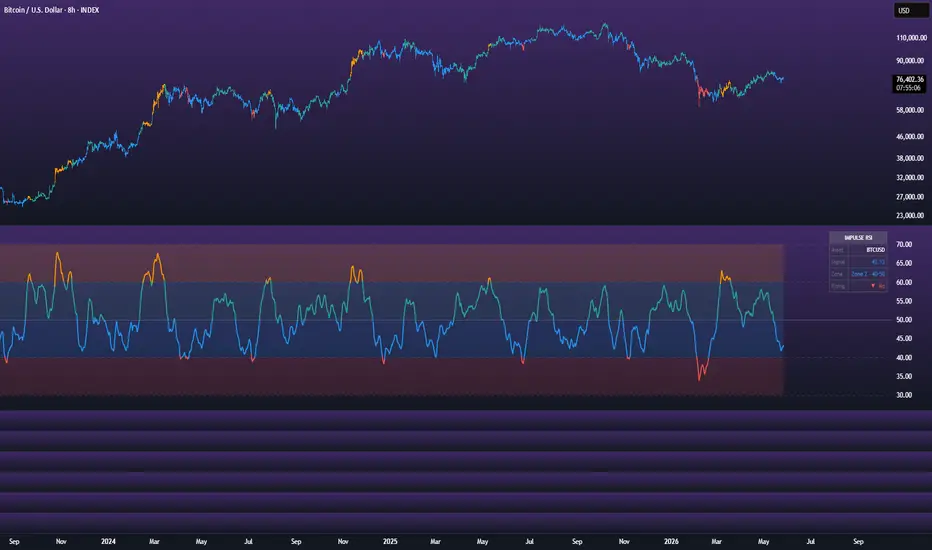
Impulse RSI is a custom oscillator that combines two classical concepts — momentum and the Relative Strength Index — into a single, unified reading. Rather than applying RSI to raw price as traditionally done, this indicator applies RSI mathematics directly to price momentum, creating a smoother and more context-aware measure of trend strength and direction. The result is a 0–100 bounded oscillator that tells you not just whether price is moving, but how much conviction sits behind that move.
How It Works
The calculation happens in three stages. First, raw momentum is measured by subtracting the price N bars ago from the current price, capturing how far price has traveled over your chosen lookback window. Second, the bar-to-bar acceleration of that momentum is computed — essentially measuring whether momentum is speeding up or slowing down. Third, Wilder's smoothing (RMA) is applied to the gains and losses of that acceleration, exactly as a standard RSI would, producing a normalized value between 0 and 100. That raw value is then smoothed with an EMA to create the final signal line you see plotted on the chart.
The key distinction from a traditional RSI is that this indicator measures the strength of momentum change, not price change. This makes it particularly sensitive to trend shifts and sustained directional moves.
The 50 Line & Direction
The 50 level is the central axis of the indicator and the most important reference point. When the signal is above 50, the indicator considers the market to be in a bullish state. When below 50, bearish. This binary directional read is also available in the Data Window as the Direction value, outputting 1 for bullish, -1 for bearish, and 0 when exactly at the midline.
Zone System
The oscillator is divided into four distinct zones, each with its own color, giving you an immediate visual read of where strength currently sits.
Zone 1 (30–40) — Red represents weak or deteriorating bearish momentum. Zone 2 (40–50) — Blue is the bearish side but showing signs of hesitation or recovery. Zone 3 (50–60) — Green is the bullish side with moderate strength. Zone 4 (60–70) — Orange reflects elevated bullish momentum and stronger conviction.
These zones are filled directly on the oscillator panel, and if bar coloring is enabled, the chart candles themselves will reflect whichever zone the signal currently occupies, giving you an at-a-glance trend context directly on your price chart without needing to look down at the indicator.
Entry Signal
Beyond simple directional bias, the indicator includes a rising signal confirmation layer. A long entry is only highlighted when two conditions are simultaneously true — the signal must be above 50 (bullish direction), and it must be higher now than it was N bars ago, confirming that the signal is actively climbing rather than simply sitting above the midline. This filters out flat or stalling bullish conditions and focuses attention on moments where momentum is genuinely building. The lookback period for this confirmation is fully adjustable, allowing you to require either a short-term or long-term rising confirmation depending on your trading style.
When enabled, these entry conditions are highlighted directly on your price chart as a background color, making them easy to spot without any manual analysis.
Alerts
A comprehensive set of alerts is built in to support both discretionary and automated trading workflows. You can be notified when the signal crosses above or below 50 for general directional conditions, when a confirmed long entry triggers, when the signal crosses into any of the four zones, and when the signal recovers from a lower zone or pulls back from a higher one. This covers the full spectrum of scenarios from trend initiation to zone transitions.
Settings
All key parameters are adjustable. The Momentum Length controls how far back the raw price momentum is measured. The RSI Length controls the smoothing applied to the acceleration gains and losses. The Signal Length controls the EMA smoothing on the final output. The Signal Lookback in the Rising Signal group controls how many bars back the indicator looks when confirming the signal is rising. Zone colors, bar coloring, and entry highlighting are all fully customizable to fit your chart setup.
Impulse RSI is a custom oscillator that combines two classical concepts — momentum and the Relative Strength Index — into a single, unified reading. Rather than applying RSI to raw price as traditionally done, this indicator applies RSI mathematics directly to price momentum, creating a smoother and more context-aware measure of trend strength and direction. The result is a 0–100 bounded oscillator that tells you not just whether price is moving, but how much conviction sits behind that move.
How It Works
The calculation happens in three stages. First, raw momentum is measured by subtracting the price N bars ago from the current price, capturing how far price has traveled over your chosen lookback window. Second, the bar-to-bar acceleration of that momentum is computed — essentially measuring whether momentum is speeding up or slowing down. Third, Wilder's smoothing (RMA) is applied to the gains and losses of that acceleration, exactly as a standard RSI would, producing a normalized value between 0 and 100. That raw value is then smoothed with an EMA to create the final signal line you see plotted on the chart.
The key distinction from a traditional RSI is that this indicator measures the strength of momentum change, not price change. This makes it particularly sensitive to trend shifts and sustained directional moves.
The 50 Line & Direction
The 50 level is the central axis of the indicator and the most important reference point. When the signal is above 50, the indicator considers the market to be in a bullish state. When below 50, bearish. This binary directional read is also available in the Data Window as the Direction value, outputting 1 for bullish, -1 for bearish, and 0 when exactly at the midline.
Zone System
The oscillator is divided into four distinct zones, each with its own color, giving you an immediate visual read of where strength currently sits.
Zone 1 (30–40) — Red represents weak or deteriorating bearish momentum. Zone 2 (40–50) — Blue is the bearish side but showing signs of hesitation or recovery. Zone 3 (50–60) — Green is the bullish side with moderate strength. Zone 4 (60–70) — Orange reflects elevated bullish momentum and stronger conviction.
These zones are filled directly on the oscillator panel, and if bar coloring is enabled, the chart candles themselves will reflect whichever zone the signal currently occupies, giving you an at-a-glance trend context directly on your price chart without needing to look down at the indicator.
Entry Signal
Beyond simple directional bias, the indicator includes a rising signal confirmation layer. A long entry is only highlighted when two conditions are simultaneously true — the signal must be above 50 (bullish direction), and it must be higher now than it was N bars ago, confirming that the signal is actively climbing rather than simply sitting above the midline. This filters out flat or stalling bullish conditions and focuses attention on moments where momentum is genuinely building. The lookback period for this confirmation is fully adjustable, allowing you to require either a short-term or long-term rising confirmation depending on your trading style.
When enabled, these entry conditions are highlighted directly on your price chart as a background color, making them easy to spot without any manual analysis.
Alerts
A comprehensive set of alerts is built in to support both discretionary and automated trading workflows. You can be notified when the signal crosses above or below 50 for general directional conditions, when a confirmed long entry triggers, when the signal crosses into any of the four zones, and when the signal recovers from a lower zone or pulls back from a higher one. This covers the full spectrum of scenarios from trend initiation to zone transitions.
Settings
All key parameters are adjustable. The Momentum Length controls how far back the raw price momentum is measured. The RSI Length controls the smoothing applied to the acceleration gains and losses. The Signal Length controls the EMA smoothing on the final output. The Signal Lookback in the Rising Signal group controls how many bars back the indicator looks when confirming the signal is rising. Zone colors, bar coloring, and entry highlighting are all fully customizable to fit your chart setup.
릴리즈 노트
//릴리즈 노트
Implementation of a table릴리즈 노트
Quick Update: Market Condition Added to TableJust pushed a small update to the Impulse RSI indicator.
Added a new "Condition" row at the top of the table that shows you at a glance whether we're in bullish, bearish, or neutral territory:
🟢 Bullish = Signal is above the upper threshold
🔴 Bearish = Signal is below the lower threshold
⚪ Neutral = Signal is in the gray zone
릴리즈 노트
added few tip to the inputs오픈 소스 스크립트
트레이딩뷰의 진정한 정신에 따라, 이 스크립트의 작성자는 이를 오픈소스로 공개하여 트레이더들이 기능을 검토하고 검증할 수 있도록 했습니다. 작성자에게 찬사를 보냅니다! 이 코드는 무료로 사용할 수 있지만, 코드를 재게시하는 경우 하우스 룰이 적용된다는 점을 기억하세요.

면책사항
해당 정보와 게시물은 금융, 투자, 트레이딩 또는 기타 유형의 조언이나 권장 사항으로 간주되지 않으며, 트레이딩뷰에서 제공하거나 보증하는 것이 아닙니다. 자세한 내용은 이용 약관을 참조하세요.
오픈 소스 스크립트
트레이딩뷰의 진정한 정신에 따라, 이 스크립트의 작성자는 이를 오픈소스로 공개하여 트레이더들이 기능을 검토하고 검증할 수 있도록 했습니다. 작성자에게 찬사를 보냅니다! 이 코드는 무료로 사용할 수 있지만, 코드를 재게시하는 경우 하우스 룰이 적용된다는 점을 기억하세요.
면책사항
해당 정보와 게시물은 금융, 투자, 트레이딩 또는 기타 유형의 조언이나 권장 사항으로 간주되지 않으며, 트레이딩뷰에서 제공하거나 보증하는 것이 아닙니다. 자세한 내용은 이용 약관을 참조하세요.