OPEN-SOURCE SCRIPT
Vortex Confluence Protocol [JOAT]
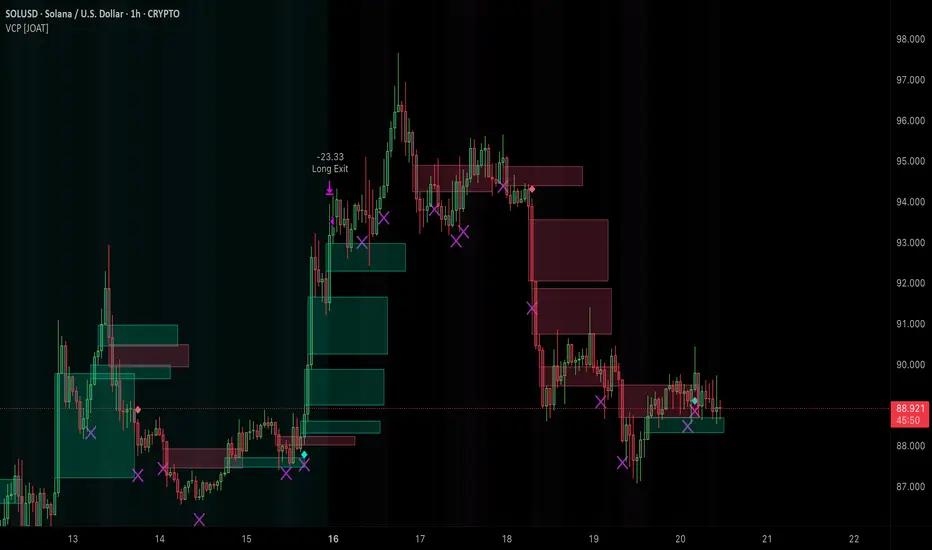
Vortex Confluence Protocol - Strategy
Introduction
The Vortex Confluence Protocol is an open-source strategy that combines market structure analysis, momentum filtering, volume confirmation, multi-timeframe alignment, session awareness, liquidity analysis, and smart money concepts into a multi-layer confluence scoring system. A trade is only taken when enough independent factors agree on direction, producing a confluence score that meets a configurable minimum threshold. The strategy includes ATR-based stop losses, risk-reward take profits, and an optional trailing stop, all designed around realistic risk management principles.
Built with Pine Script v6, the strategy uses custom types for trade state, confluence scoring, quantum state, liquidity state, smart money state, and market regime detection.

Why This Strategy Exists
Most strategies rely on one or two conditions for entry — a moving average crossover, an RSI level, or a pattern match. These single-factor approaches are fragile because they lack confirmation from other market dimensions. The Vortex Confluence Protocol takes the opposite approach: it requires agreement across multiple independent analytical layers before committing capital. This multi-factor design aims to:
Strategy Default Properties
The strategy is published with the following default properties, which are critical to understanding the backtesting results:
These defaults are intentionally conservative. The commission and slippage settings are included to produce realistic results that account for real-world execution costs. The 2% position size and 1% risk per trade ensure that no single trade can significantly damage the account.
Core Components Explained
1. Market Structure Analysis
The strategy uses pivot-based swing detection to identify the market's structural direction. It tracks swing highs and swing lows, then classifies structural events:
The structure direction variable tracks the prevailing bias. When `requireBOS` is enabled (default), the strategy requires a fresh BOS or CHoCH event for entry, ensuring trades are taken at structurally significant moments rather than during drift.
2. FVG Confluence
Fair Value Gaps are detected using the standard three-bar pattern, filtered by a minimum size of 0.3x ATR. The strategy maintains arrays of active FVGs and checks whether current price is inside any bullish or bearish FVG zone. When `requireFVG` is enabled (default), the strategy requires price to be within an FVG zone aligned with the trade direction, adding an imbalance-based confirmation layer.
Pine Script®
FVG zones older than 30 bars are automatically cleaned up to prevent stale zones from influencing current decisions.
3. Momentum Analysis
The momentum layer uses RSI with configurable length (default 14) and overbought/oversold levels (default 70/30). The RSI is smoothed with a 3-period EMA, and its rate of change is calculated to determine momentum direction:
The strategy also detects RSI divergences as additional context, though divergences alone do not trigger entries.
4. Volume Analysis
Volume confirmation requires the current volume to exceed a configurable multiple (default 1.2x) of the volume moving average. Additionally, the strategy estimates buying and selling volume using candle structure and calculates cumulative delta over 10 bars:
Volume anomalies (Z-score > 2.0) receive a bonus point in the confluence scoring system.
5. Multi-Timeframe Filter
The MTF filter fetches close, EMA, and RSI from a configurable higher timeframe (default 60m) using `request.security()` with `barmerge.lookahead_off` to prevent repainting. The higher timeframe trend must agree with the trade direction:
Pine Script®
This ensures trades are taken in the direction of the larger trend, filtering out counter-trend entries that have lower win rates.
6. Session and Regime Filters
The session filter restricts trading to a configurable active session (default 0800-1600 EST). Trading outside of liquid market hours often produces worse fills and more erratic price action.
The regime filter uses ADX to classify the market as trending (ADX > 25) or ranging. In a trending regime, the strategy only takes trades in the trend direction. In a ranging regime, both directions are allowed. This prevents the strategy from fighting strong trends.
Chart showing the Vortex Confluence Protocol with entry signals, stop loss and take profit levels drawn on the chart, FVG zones highlighted, and the dashboard displaying the confluence score breakdown
7. Confluence Scoring System
The heart of the strategy is the confluence scoring system. Each analytical layer contributes points to a total score:
The total score must meet the minimum confluence threshold (default 3) for an entry to be considered. Additionally, all directional filters must agree — structure, momentum, MTF, volume, session, quantum, and smart money must all either support the direction or be disabled.
8. Risk Management
Stop Loss: Calculated as the tighter of two values: the ATR-based stop (close minus ATR * SL multiplier) or the recent swing low minus a small ATR buffer (for longs). This ensures the stop is placed at a structurally meaningful level.
Pine Script®
Take Profit: Calculated as the entry price plus the stop distance multiplied by the risk-reward ratio (default 2.0). A 2:1 RR means the strategy needs to win only 34% of trades to break even (before commissions).
Trailing Stop: When enabled, the trailing stop follows price at a distance of ATR * trail multiplier (default 2.0). It only moves in the favorable direction, locking in profits as the trade progresses. The trailing stop updates the exit order dynamically.

Entry Conditions Summary
A long entry requires ALL of the following:
Short entries require the inverse conditions.
Backtesting Considerations
Important notes about the published results:
Parameter sensitivity: The minimum confluence score is the most impactful parameter. Lower values (2-3) produce more trades but with lower average quality. Higher values (4-5) produce fewer, higher-quality trades but may miss valid setups. The default of 3 represents a balance between trade frequency and quality.
Optimization warning: Over-optimizing parameters to fit historical data will produce misleading results. The default parameters are designed to be reasonable across a range of instruments rather than perfectly fitted to any single one. If you adjust parameters, test across multiple instruments and time periods to verify robustness.
Sample size: For meaningful statistical analysis, ensure the backtest produces at least 100 trades. On higher timeframes or with high confluence requirements, you may need to extend the backtest period to achieve sufficient sample size.
Strategy performance panel showing trade list, equity curve, and key metrics with the confluence dashboard visible on the chart
Input Parameters
Strategy Settings:
Advanced Features:
Risk Management:
Market Structure:
Momentum:
Multi-Timeframe:
Volume:
Session:
Visual:
How to Use This Strategy
Step 1: Apply the strategy to your instrument and timeframe. Review the default settings and adjust the session times and timezone to match your market.
Step 2: Run the backtest and review the results. Check the total number of trades — if fewer than 100, consider lowering the minimum confluence score or extending the backtest period.
Step 3: Review the equity curve for consistency. A healthy equity curve shows steady growth without extreme drawdowns. Large drawdowns followed by recovery may indicate the strategy is taking excessive risk.
Step 4: Use the dashboard to understand why trades are being taken. The confluence score breakdown shows which factors are contributing to each entry.
Step 5: If adapting parameters, change one at a time and test across multiple instruments. Avoid optimizing all parameters simultaneously, as this leads to curve-fitting.
Step 6: Consider using the strategy's signals as a filter for manual trading rather than as a fully automated system. The confluence score provides a quantified measure of setup quality that can inform discretionary decisions.
Strategy Limitations
Originality Statement
This strategy is original in its multi-layer confluence scoring approach. While individual components (structure detection, RSI, volume analysis, MTF filtering) are established concepts, this strategy is justified because:
Disclaimer
This strategy is provided for educational and informational purposes only. It is not financial advice or a recommendation to buy or sell any financial instrument. Trading involves substantial risk of loss and is not suitable for all investors. Backtesting results are hypothetical and do not guarantee future performance. Past performance is not indicative of future results. The strategy's results depend heavily on the instrument, timeframe, and market conditions. Commission, slippage, and execution quality in live trading may differ significantly from backtesting assumptions. Always use proper risk management, including position sizing appropriate for your account size and risk tolerance. Never risk more than you can afford to lose. The author is not responsible for any losses incurred from using this strategy.
-Made with passion by officialjackofalltrades
Introduction
The Vortex Confluence Protocol is an open-source strategy that combines market structure analysis, momentum filtering, volume confirmation, multi-timeframe alignment, session awareness, liquidity analysis, and smart money concepts into a multi-layer confluence scoring system. A trade is only taken when enough independent factors agree on direction, producing a confluence score that meets a configurable minimum threshold. The strategy includes ATR-based stop losses, risk-reward take profits, and an optional trailing stop, all designed around realistic risk management principles.
Built with Pine Script v6, the strategy uses custom types for trade state, confluence scoring, quantum state, liquidity state, smart money state, and market regime detection.
Why This Strategy Exists
Most strategies rely on one or two conditions for entry — a moving average crossover, an RSI level, or a pattern match. These single-factor approaches are fragile because they lack confirmation from other market dimensions. The Vortex Confluence Protocol takes the opposite approach: it requires agreement across multiple independent analytical layers before committing capital. This multi-factor design aims to:
- Reduce false signals: By requiring confluence from structure, momentum, volume, and MTF analysis simultaneously, the strategy filters out low-conviction setups
- Adapt to market conditions: The regime filter (ADX-based) prevents trend-following entries during ranging markets and vice versa
- Enforce discipline: The confluence scoring system makes the entry criteria explicit and quantifiable, removing subjective judgment from the entry decision
- Manage risk systematically: ATR-based stops, configurable risk-reward ratios, and trailing stops provide a structured risk management framework
Strategy Default Properties
The strategy is published with the following default properties, which are critical to understanding the backtesting results:
- Initial Capital: $100,000
- Position Size: 2% of equity per trade
- Commission: 0.1% per trade (round-trip 0.2%)
- Slippage: 2 ticks per order
- Pyramiding: 0 (no adding to positions)
- Risk Per Trade: 1.0% of account
- Risk:Reward Ratio: 2.0 (target is 2x the stop distance)
These defaults are intentionally conservative. The commission and slippage settings are included to produce realistic results that account for real-world execution costs. The 2% position size and 1% risk per trade ensure that no single trade can significantly damage the account.
Core Components Explained
1. Market Structure Analysis
The strategy uses pivot-based swing detection to identify the market's structural direction. It tracks swing highs and swing lows, then classifies structural events:
- Break of Structure (BOS): Price breaks above the last swing high (bullish BOS) or below the last swing low (bearish BOS), confirming the existing trend
- Change of Character (CHoCH): Price breaks a previous swing point against the current trend direction, signaling a potential reversal
The structure direction variable tracks the prevailing bias. When `requireBOS` is enabled (default), the strategy requires a fresh BOS or CHoCH event for entry, ensuring trades are taken at structurally significant moments rather than during drift.
2. FVG Confluence
Fair Value Gaps are detected using the standard three-bar pattern, filtered by a minimum size of 0.3x ATR. The strategy maintains arrays of active FVGs and checks whether current price is inside any bullish or bearish FVG zone. When `requireFVG` is enabled (default), the strategy requires price to be within an FVG zone aligned with the trade direction, adding an imbalance-based confirmation layer.
FVG zones older than 30 bars are automatically cleaned up to prevent stale zones from influencing current decisions.
3. Momentum Analysis
The momentum layer uses RSI with configurable length (default 14) and overbought/oversold levels (default 70/30). The RSI is smoothed with a 3-period EMA, and its rate of change is calculated to determine momentum direction:
- Bullish momentum: Smoothed RSI above 50, RSI rising, and not overbought
- Bearish momentum: Smoothed RSI below 50, RSI falling, and not oversold
The strategy also detects RSI divergences as additional context, though divergences alone do not trigger entries.
4. Volume Analysis
Volume confirmation requires the current volume to exceed a configurable multiple (default 1.2x) of the volume moving average. Additionally, the strategy estimates buying and selling volume using candle structure and calculates cumulative delta over 10 bars:
- Bullish volume: High relative volume + positive delta + positive cumulative delta
- Bearish volume: High relative volume + negative delta + negative cumulative delta
Volume anomalies (Z-score > 2.0) receive a bonus point in the confluence scoring system.
5. Multi-Timeframe Filter
The MTF filter fetches close, EMA, and RSI from a configurable higher timeframe (default 60m) using `request.security()` with `barmerge.lookahead_off` to prevent repainting. The higher timeframe trend must agree with the trade direction:
This ensures trades are taken in the direction of the larger trend, filtering out counter-trend entries that have lower win rates.
6. Session and Regime Filters
The session filter restricts trading to a configurable active session (default 0800-1600 EST). Trading outside of liquid market hours often produces worse fills and more erratic price action.
The regime filter uses ADX to classify the market as trending (ADX > 25) or ranging. In a trending regime, the strategy only takes trades in the trend direction. In a ranging regime, both directions are allowed. This prevents the strategy from fighting strong trends.
Chart showing the Vortex Confluence Protocol with entry signals, stop loss and take profit levels drawn on the chart, FVG zones highlighted, and the dashboard displaying the confluence score breakdown
7. Confluence Scoring System
The heart of the strategy is the confluence scoring system. Each analytical layer contributes points to a total score:
- Structure: 1 point for structural direction alignment, +1 bonus if price is in an aligned FVG
- Momentum: 1 point for momentum alignment
- Volume: 1 point for volume confirmation, +1 bonus for anomaly
- MTF: 1 point for higher timeframe alignment
- Session: 1 point if within active session
- Liquidity: 1 point for medium+ liquidity level, +1 bonus for sweep
- Quantum: 1 point for quantum collapse, +1 bonus for high coherence
- Smart Money: 1 point for positive SM score, +1 bonus for clear accumulation/distribution
- Harmonic: 1 point for harmonic alignment
The total score must meet the minimum confluence threshold (default 3) for an entry to be considered. Additionally, all directional filters must agree — structure, momentum, MTF, volume, session, quantum, and smart money must all either support the direction or be disabled.
8. Risk Management
Stop Loss: Calculated as the tighter of two values: the ATR-based stop (close minus ATR * SL multiplier) or the recent swing low minus a small ATR buffer (for longs). This ensures the stop is placed at a structurally meaningful level.
Take Profit: Calculated as the entry price plus the stop distance multiplied by the risk-reward ratio (default 2.0). A 2:1 RR means the strategy needs to win only 34% of trades to break even (before commissions).
Trailing Stop: When enabled, the trailing stop follows price at a distance of ATR * trail multiplier (default 2.0). It only moves in the favorable direction, locking in profits as the trade progresses. The trailing stop updates the exit order dynamically.
Entry Conditions Summary
A long entry requires ALL of the following:
- Long trades enabled
- Confluence score >= minimum threshold
- Structure direction is bullish
- Momentum is not bearish (or momentum filter disabled)
- MTF is not bearish (or MTF filter disabled)
- Volume is not bearish (or volume filter disabled)
- Within active session (or session filter disabled)
- Regime allows longs
- Quantum superposition is positive (or quantum filter disabled)
- Smart money score is non-negative (or SM filter disabled)
- Price is in a bullish FVG (if requireFVG enabled)
- A BOS or CHoCH has occurred (if requireBOS enabled)
- No existing position
Short entries require the inverse conditions.
Backtesting Considerations
Important notes about the published results:
- Results include 0.1% commission per trade and 2 ticks slippage to simulate realistic execution
- The strategy uses 2% of equity per trade, not 100% — this significantly reduces both returns and drawdowns compared to full-equity strategies
- Pyramiding is disabled (0), meaning only one position can be open at a time
- The strategy does not use leverage beyond what the position size implies
- Results will vary significantly across different instruments, timeframes, and market conditions
- Past performance does not indicate future results
Parameter sensitivity: The minimum confluence score is the most impactful parameter. Lower values (2-3) produce more trades but with lower average quality. Higher values (4-5) produce fewer, higher-quality trades but may miss valid setups. The default of 3 represents a balance between trade frequency and quality.
Optimization warning: Over-optimizing parameters to fit historical data will produce misleading results. The default parameters are designed to be reasonable across a range of instruments rather than perfectly fitted to any single one. If you adjust parameters, test across multiple instruments and time periods to verify robustness.
Sample size: For meaningful statistical analysis, ensure the backtest produces at least 100 trades. On higher timeframes or with high confluence requirements, you may need to extend the backtest period to achieve sufficient sample size.
Strategy performance panel showing trade list, equity curve, and key metrics with the confluence dashboard visible on the chart
Input Parameters
Strategy Settings:
- Enable Long/Short Trades independently
- Minimum Confluence Score (default 3)
- Use Regime Filter, Session Filter
Advanced Features:
- Quantum Confluence, Liquidity Analysis, Smart Money Concepts, Harmonic Patterns toggles
- Quantum Coherence Threshold (default 0.7)
Risk Management:
- Risk Per Trade (default 1.0%)
- Risk:Reward Ratio (default 2.0)
- Trailing Stop toggle and ATR Multiplier (default 2.0)
- Stop Loss ATR Multiplier (default 1.5)
Market Structure:
- Pivot Strength (default 5)
- Require BOS/CHoCH and Require FVG Confluence toggles
Momentum:
- RSI Length (default 14), Overbought (70), Oversold (30)
- Require Momentum Alignment toggle
Multi-Timeframe:
- Higher Timeframe (default 60m)
- MTF Trend Length (default 20)
Volume:
- Volume MA Length (default 20) and Volume Threshold (default 1.2)
Session:
- Active Trading Session (default 0800-1600)
- Timezone selection
Visual:
- Show Entry Signals, SL/TP Levels, Dashboard, FVG Zones
How to Use This Strategy
Step 1: Apply the strategy to your instrument and timeframe. Review the default settings and adjust the session times and timezone to match your market.
Step 2: Run the backtest and review the results. Check the total number of trades — if fewer than 100, consider lowering the minimum confluence score or extending the backtest period.
Step 3: Review the equity curve for consistency. A healthy equity curve shows steady growth without extreme drawdowns. Large drawdowns followed by recovery may indicate the strategy is taking excessive risk.
Step 4: Use the dashboard to understand why trades are being taken. The confluence score breakdown shows which factors are contributing to each entry.
Step 5: If adapting parameters, change one at a time and test across multiple instruments. Avoid optimizing all parameters simultaneously, as this leads to curve-fitting.
Step 6: Consider using the strategy's signals as a filter for manual trading rather than as a fully automated system. The confluence score provides a quantified measure of setup quality that can inform discretionary decisions.
Strategy Limitations
- The strategy uses market orders for entry, which means execution price may differ from the signal price, especially on volatile instruments or during news events
- Delta and volume analysis use candle-structure estimation, not actual order flow data. This is an approximation.
- The multi-factor requirement means the strategy will miss valid moves that only satisfy some conditions. This is by design — it prioritizes quality over quantity.
- Backtesting results assume orders are filled at the close of the signal bar. Real-world execution may differ.
- The strategy does not account for overnight gaps, dividend adjustments, or corporate events that can cause sudden price changes
- Higher confluence requirements reduce trade frequency, which may not suit traders who need frequent activity
- The regime filter uses ADX, which has an inherent lag in detecting regime changes
- Commission and slippage settings should be adjusted to match your actual broker costs for accurate backtesting
Originality Statement
This strategy is original in its multi-layer confluence scoring approach. While individual components (structure detection, RSI, volume analysis, MTF filtering) are established concepts, this strategy is justified because:
- It synthesizes nine independent analytical layers into a quantified confluence scoring system, providing a structured framework for multi-factor trade evaluation
- The regime-aware filtering automatically adjusts entry criteria based on ADX-detected market conditions
- Liquidity analysis with sweep detection and absorption ratio adds an institutional activity layer not found in standard multi-factor strategies
- The quantum coherence scoring provides a novel metric for measuring the consistency of agreement across all analytical layers
- Smart money phase detection (accumulation/distribution) adds a Wyckoff-inspired context layer to the entry decision
- The risk management system combines structural stop placement (recent swing + ATR buffer) with dynamic trailing, providing both initial protection and profit locking
- All entry conditions are explicit and quantifiable, making the strategy fully transparent and reproducible
Disclaimer
This strategy is provided for educational and informational purposes only. It is not financial advice or a recommendation to buy or sell any financial instrument. Trading involves substantial risk of loss and is not suitable for all investors. Backtesting results are hypothetical and do not guarantee future performance. Past performance is not indicative of future results. The strategy's results depend heavily on the instrument, timeframe, and market conditions. Commission, slippage, and execution quality in live trading may differ significantly from backtesting assumptions. Always use proper risk management, including position sizing appropriate for your account size and risk tolerance. Never risk more than you can afford to lose. The author is not responsible for any losses incurred from using this strategy.
-Made with passion by officialjackofalltrades
오픈 소스 스크립트
트레이딩뷰의 진정한 정신에 따라, 이 스크립트의 작성자는 이를 오픈소스로 공개하여 트레이더들이 기능을 검토하고 검증할 수 있도록 했습니다. 작성자에게 찬사를 보냅니다! 이 코드는 무료로 사용할 수 있지만, 코드를 재게시하는 경우 하우스 룰이 적용된다는 점을 기억하세요.

The AI Trading Ecosystem, Built to win trades 📈
Get Full Access 👇
jackofalltrades.vip 🌐
t.me/jackofalltradesvip 🃏
Get Full Access 👇
jackofalltrades.vip 🌐
t.me/jackofalltradesvip 🃏
면책사항
해당 정보와 게시물은 금융, 투자, 트레이딩 또는 기타 유형의 조언이나 권장 사항으로 간주되지 않으며, 트레이딩뷰에서 제공하거나 보증하는 것이 아닙니다. 자세한 내용은 이용 약관을 참조하세요.
오픈 소스 스크립트
트레이딩뷰의 진정한 정신에 따라, 이 스크립트의 작성자는 이를 오픈소스로 공개하여 트레이더들이 기능을 검토하고 검증할 수 있도록 했습니다. 작성자에게 찬사를 보냅니다! 이 코드는 무료로 사용할 수 있지만, 코드를 재게시하는 경우 하우스 룰이 적용된다는 점을 기억하세요.
The AI Trading Ecosystem, Built to win trades 📈
Get Full Access 👇
jackofalltrades.vip 🌐
t.me/jackofalltradesvip 🃏
Get Full Access 👇
jackofalltrades.vip 🌐
t.me/jackofalltradesvip 🃏
면책사항
해당 정보와 게시물은 금융, 투자, 트레이딩 또는 기타 유형의 조언이나 권장 사항으로 간주되지 않으며, 트레이딩뷰에서 제공하거나 보증하는 것이 아닙니다. 자세한 내용은 이용 약관을 참조하세요.