OPEN-SOURCE SCRIPT
Regime-Filtered RSI Value Zones
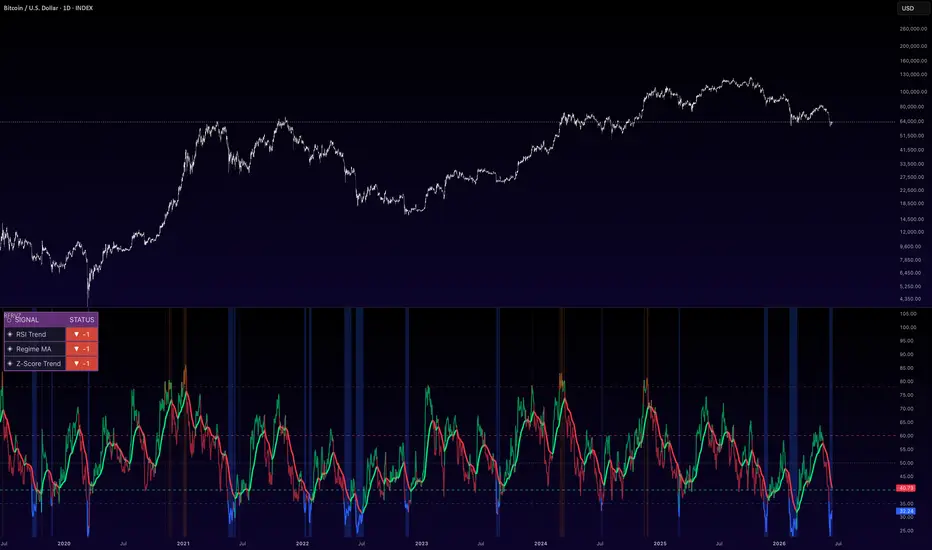
Regime-Filtered RSI Value Zones (RFRVZ)
// A three-layer RSI system combining regime detection, momentum direction
// and Z-score confirmation to identify dynamic DCA buy and sell value zones.
A three-layer RSI-based indicator designed to identify high-probability DCA accumulation and distribution zones on any asset.
How it works:
Layer 1 — RSI Momentum Direction
A user-selectable Moving Average is applied directly to the RSI to identify the current momentum direction. Eight MA types are available including SMA, EMA, HMA, DEMA and TEMA giving full flexibility to tune sensitivity. The MA line plots green when RSI is above it and red when below — providing instant momentum bias at a glance.
Layer 2 — RSI Z-Score
The RSI is normalised against its own recent historical distribution using a Z-Score. This identifies whether current RSI momentum is statistically above or below its recent mean — filtering out weak or noise-driven signals and confirming only statistically meaningful momentum moves.
Layer 3 — DCA Value Zones
Two user-defined RSI threshold levels define the Buy Zone and Sell Zone. When RSI drops into the Buy Zone the panel highlights blue and a single DCA In label fires on entry. When RSI reaches the Sell Zone the panel highlights brown and a DCA Out label fires. Labels are state-managed — one label per zone visit, no repeats until RSI exits and re-enters the zone.
Features:
8 selectable MA types for the RSI smoothing layer
Fully adjustable Buy and Sell Zone thresholds
Adjustable Overbought and Oversold reference levels
Optional Z-Score plot rescaled to RSI scale for direct visual comparison
Toggle for DCA In / Out labels
Clean panel background zone highlighting
// A three-layer RSI system combining regime detection, momentum direction
// and Z-score confirmation to identify dynamic DCA buy and sell value zones.
A three-layer RSI-based indicator designed to identify high-probability DCA accumulation and distribution zones on any asset.
How it works:
Layer 1 — RSI Momentum Direction
A user-selectable Moving Average is applied directly to the RSI to identify the current momentum direction. Eight MA types are available including SMA, EMA, HMA, DEMA and TEMA giving full flexibility to tune sensitivity. The MA line plots green when RSI is above it and red when below — providing instant momentum bias at a glance.
Layer 2 — RSI Z-Score
The RSI is normalised against its own recent historical distribution using a Z-Score. This identifies whether current RSI momentum is statistically above or below its recent mean — filtering out weak or noise-driven signals and confirming only statistically meaningful momentum moves.
Layer 3 — DCA Value Zones
Two user-defined RSI threshold levels define the Buy Zone and Sell Zone. When RSI drops into the Buy Zone the panel highlights blue and a single DCA In label fires on entry. When RSI reaches the Sell Zone the panel highlights brown and a DCA Out label fires. Labels are state-managed — one label per zone visit, no repeats until RSI exits and re-enters the zone.
Features:
8 selectable MA types for the RSI smoothing layer
Fully adjustable Buy and Sell Zone thresholds
Adjustable Overbought and Oversold reference levels
Optional Z-Score plot rescaled to RSI scale for direct visual comparison
Toggle for DCA In / Out labels
Clean panel background zone highlighting
오픈 소스 스크립트
트레이딩뷰의 진정한 정신에 따라, 이 스크립트의 작성자는 이를 오픈소스로 공개하여 트레이더들이 기능을 검토하고 검증할 수 있도록 했습니다. 작성자에게 찬사를 보냅니다! 이 코드는 무료로 사용할 수 있지만, 코드를 재게시하는 경우 하우스 룰이 적용된다는 점을 기억하세요.

면책사항
해당 정보와 게시물은 금융, 투자, 트레이딩 또는 기타 유형의 조언이나 권장 사항으로 간주되지 않으며, 트레이딩뷰에서 제공하거나 보증하는 것이 아닙니다. 자세한 내용은 이용 약관을 참조하세요.
오픈 소스 스크립트
트레이딩뷰의 진정한 정신에 따라, 이 스크립트의 작성자는 이를 오픈소스로 공개하여 트레이더들이 기능을 검토하고 검증할 수 있도록 했습니다. 작성자에게 찬사를 보냅니다! 이 코드는 무료로 사용할 수 있지만, 코드를 재게시하는 경우 하우스 룰이 적용된다는 점을 기억하세요.
면책사항
해당 정보와 게시물은 금융, 투자, 트레이딩 또는 기타 유형의 조언이나 권장 사항으로 간주되지 않으며, 트레이딩뷰에서 제공하거나 보증하는 것이 아닙니다. 자세한 내용은 이용 약관을 참조하세요.