OPEN-SOURCE SCRIPT
Volume Terminal [Institutional Edition]
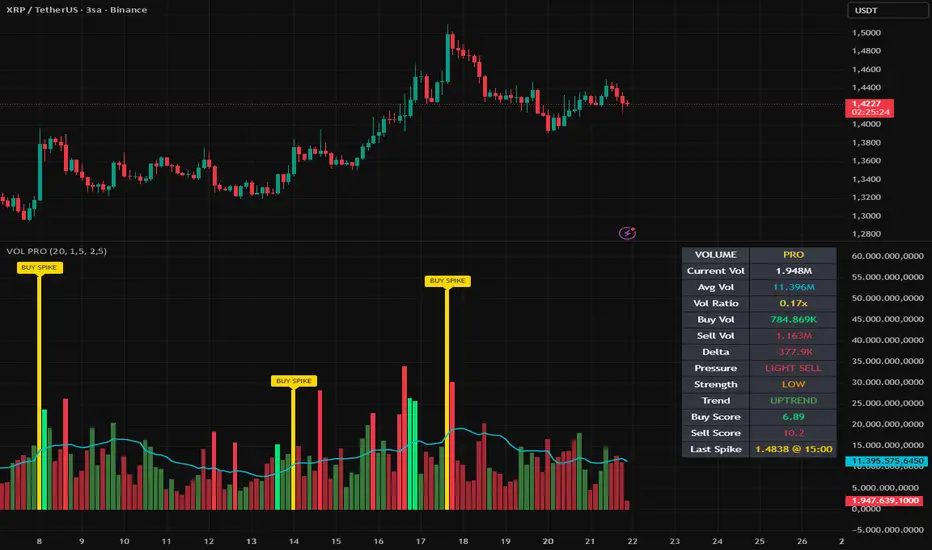
VOLUME TERMINAL PRO is a volume analysis tool designed to help users interpret participation, activity shifts, and relative market interest through a structured dashboard-style interface.
The script focuses on how trading volume changes over time and how unusual increases or decreases may provide additional context to price movement.
Rather than viewing raw volume bars alone, this tool organizes volume behavior into a cleaner workflow that may help users evaluate momentum participation, breakout interest, and quiet market phases.
It is intended for traders who use volume as part of their chart analysis and prefer a more efficient way to monitor market activity across multiple assets and timeframes.
The focus is clarity, structured observation, and practical volume-based chart workflow.
This tool may help users with:
Monitoring rising or falling participation levels
Identifying unusual volume spikes
Supporting breakout confirmation analysis
Detecting low-activity consolidation phases
Comparing current volume vs average activity
Organizing volume data in one interface
Suitable for:
Volume traders
Breakout traders
Swing traders
Intraday traders
Momentum traders
Users seeking cleaner dashboard tools
If structured market activity tools and dashboard-style analysis are part of your workflow, you may also find additional research tools available on this profile useful.
The script focuses on how trading volume changes over time and how unusual increases or decreases may provide additional context to price movement.
Rather than viewing raw volume bars alone, this tool organizes volume behavior into a cleaner workflow that may help users evaluate momentum participation, breakout interest, and quiet market phases.
It is intended for traders who use volume as part of their chart analysis and prefer a more efficient way to monitor market activity across multiple assets and timeframes.
The focus is clarity, structured observation, and practical volume-based chart workflow.
This tool may help users with:
Monitoring rising or falling participation levels
Identifying unusual volume spikes
Supporting breakout confirmation analysis
Detecting low-activity consolidation phases
Comparing current volume vs average activity
Organizing volume data in one interface
Suitable for:
Volume traders
Breakout traders
Swing traders
Intraday traders
Momentum traders
Users seeking cleaner dashboard tools
If structured market activity tools and dashboard-style analysis are part of your workflow, you may also find additional research tools available on this profile useful.
오픈 소스 스크립트
트레이딩뷰의 진정한 정신에 따라, 이 스크립트의 작성자는 이를 오픈소스로 공개하여 트레이더들이 기능을 검토하고 검증할 수 있도록 했습니다. 작성자에게 찬사를 보냅니다! 이 코드는 무료로 사용할 수 있지만, 코드를 재게시하는 경우 하우스 룰이 적용된다는 점을 기억하세요.

면책사항
해당 정보와 게시물은 금융, 투자, 트레이딩 또는 기타 유형의 조언이나 권장 사항으로 간주되지 않으며, 트레이딩뷰에서 제공하거나 보증하는 것이 아닙니다. 자세한 내용은 이용 약관을 참조하세요.
오픈 소스 스크립트
트레이딩뷰의 진정한 정신에 따라, 이 스크립트의 작성자는 이를 오픈소스로 공개하여 트레이더들이 기능을 검토하고 검증할 수 있도록 했습니다. 작성자에게 찬사를 보냅니다! 이 코드는 무료로 사용할 수 있지만, 코드를 재게시하는 경우 하우스 룰이 적용된다는 점을 기억하세요.
면책사항
해당 정보와 게시물은 금융, 투자, 트레이딩 또는 기타 유형의 조언이나 권장 사항으로 간주되지 않으며, 트레이딩뷰에서 제공하거나 보증하는 것이 아닙니다. 자세한 내용은 이용 약관을 참조하세요.