OPEN-SOURCE SCRIPT
Smart Volume Profile VPVR POC, Value Area, SR [LunqFX]
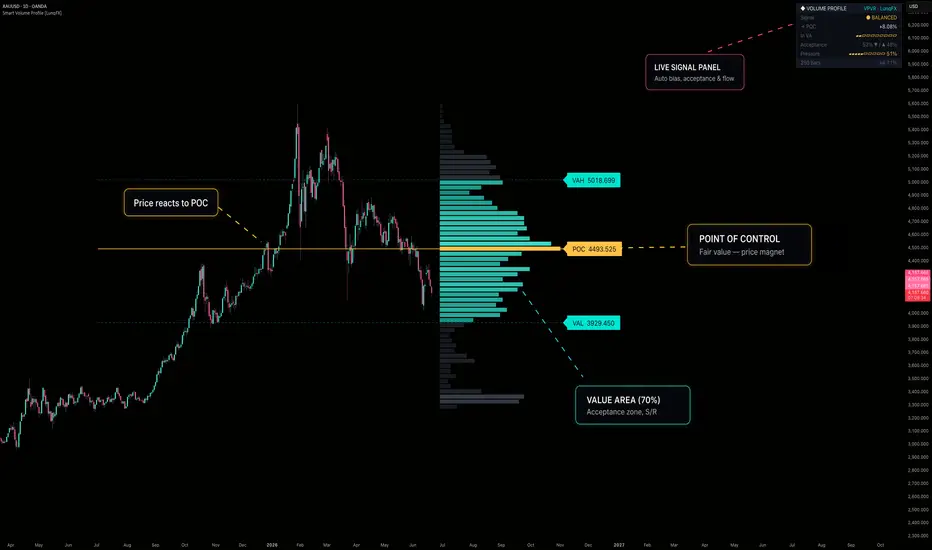
Smart Volume Profile VPVR is a modern, professional-grade volume profile indicator for TradingView that turns raw traded volume into the cleanest possible map of where the market actually did business. It plots the Point of Control (POC), the full 70% Value Area (VAH / VAL), and every High and Low Volume Node (HVN / LVN) as glowing, easy-to-read horizontal support and resistance levels — on any symbol and any timeframe: forex, crypto, stocks, indices, futures, gold (XAUUSD), Bitcoin (BTCUSD), NASDAQ, S&P 500, oil and more. Unlike a plain histogram, this VPVR (Volume Profile Visible Range) tool layers a live order-flow dashboard on top that reads the market in real time and tells you whether price is accepting value, rejecting value, rotating back to fair value, or breaking out — the exact context that separates profitable volume-profile trading from guessing. Built entirely in Pine Script v6 with neon gradient candles and a fully readable, gradient-coloured profile, it is designed to be both beautiful and genuinely useful for day trading, scalping, swing trading and intraday analysis.
◆ WHY VOLUME PROFILE MATTERS
Most indicators are based on price and time. Volume profile is based on price and volume — it answers a completely different and more important question: at which prices did the most trading actually happen? Those prices are where institutions, liquidity and "fair value" concentrate. High-volume areas act as magnets and strong support/resistance; low-volume areas are vacuums that price rips through. By making this structure obvious, Smart Volume Profile helps you trade with the auction instead of against it.
◆ WHAT IT DRAWS ON THE CHART
POC — Point of Control (gold ray): the single most-traded price in the window. This is the market's fairest value and its strongest magnet. Price returns to the POC again and again; it is the most important pivot on the chart.
VAH / VAL — Value Area High & Low (dashed rays): the top and bottom of the zone that contains 70% of all traded volume (fully configurable, 40–95%). Inside this band the market is "comfortable"; outside it the market is in discovery / imbalance.
High Volume Nodes (HVN): thick, bright rows = heavy acceptance = strong support & resistance and reaction/reversal zones.
Low Volume Nodes (LVN): thin, dim rows = rejection / fast-move zones where price tends to travel quickly and gap.
Gradient histogram: every row is colour-graded by its volume, so the profile literally glows where volume is heaviest — you read the structure at a glance instead of squinting at bars.
All levels extend as live rays with clean, high-contrast labels showing the exact price.
◆ THE LIVE DASHBOARD PANEL (this is what makes it "Smart")

A plain volume profile just draws lines. This indicator adds a compact, modern analytics panel that computes context you cannot see on the chart and condenses it into one glance:
Signal — the headline call, colour-coded: ▲ LONG revert, ▼ SHORT revert, ▲ BREAKOUT, ▼ BREAKDOWN, or ● BALANCED. This is the playbook for the current moment (logic explained below).
→ POC — the live distance from current price to the Point of Control, in %. This is your mean-reversion target and a quick read of how stretched price is from fair value.
In VA — a clean segmented meter showing where price currently sits inside the value area (from VAL on the left to VAH on the right). Instantly tells you if you're at the top, middle, or bottom of value.
Acceptance — the split of volume traded above vs below the POC (e.g. 52% ▼ / ▲ 48%). Reveals which side the market is building value on — a directional bias the chart hides.
Pressure — a segmented meter of buy volume vs sell volume across the whole window. Shows whether buyers or sellers are in control of the auction.
Footer — the lookback size and the actual % of volume captured by the value area, so you always know the context behind the numbers.
The panel is fully themeable (position, background, accent) and stays readable on dark charts.
◆ HOW IT WORKS (under the hood)
Binning: the chosen lookback window is divided into price rows ("buckets"). Resolution is adjustable for coarse or razor-sharp profiles.
True volume distribution: instead of dumping each bar's volume at its close, the indicator can spread each bar's volume across every price it actually traded through (high→low), producing a far more accurate profile than close-only methods.
POC detection: the row with the maximum accumulated volume becomes the Point of Control — by construction always the longest bar in the histogram.
Value Area expansion: starting from the POC, the algorithm steps outward toward whichever neighbouring row holds more volume, accumulating until the target (default 70%) of total volume is enclosed. The final boundaries become VAH and VAL — the same methodology used in classic Market Profile.
Order-flow analytics: the script measures volume above vs below the POC (Acceptance) and buy-bar vs sell-bar volume (Pressure) across the window.
Smart Signal engine: it blends Acceptance and Pressure into a single order-flow reading and combines it with price location relative to the value area to classify the situation as a rotation or a breakout (see below).
◆ THE SMART SIGNAL LOGIC
A naive volume-profile tool always says "revert to POC", which gets you run over in trends. This one is smarter:
Price BELOW value + order flow NOT confirming the drop → ▲ LONG revert (rotation back to POC).
Price BELOW value + order flow confirming the drop → ▼ BREAKDOWN (continuation — don't catch the knife).
Price ABOVE value + order flow NOT confirming the push → ▼ SHORT revert (rotation back to POC).
Price ABOVE value + order flow confirming the push → ▲ BREAKOUT (continuation — trade with it).
Price INSIDE value → ● BALANCED (range conditions — fade the edges back toward POC).
This single distinction — rotation vs breakout — is the difference between fading a pullback and getting trapped against a trend.
◆ HOW TO USE IT
Mean-reversion / range trading: in BALANCED or revert states, fade moves at VAH/VAL back toward the POC. The → POC distance is your target; HVN rows are logical stop zones.
Breakout / trend trading: in BREAKOUT / BREAKDOWN states, trade in the direction of the move and target the next HVN. Avoid counter-trend fades when order flow confirms the break.
Support & resistance mapping: treat thick HVN rows as high-probability reaction zones and expect rapid, low-resistance moves through LVN gaps.
Bias & confluence: use Acceptance and Pressure for directional bias, and combine the POC/VAH/VAL levels with your own structure, liquidity, order blocks or session tools for higher-conviction entries.
Multi-timeframe: raise the Lookback for higher-timeframe value (swing context), lower it for intraday/scalping context. Increase Rows for more precise POC placement.
◆ SETTINGS
Volume Profile Engine: Lookback (bars), Rows (resolution), Value Area %, true-range volume distribution toggle.
Profile Look: width, gap from price, anchor side (right of price / classic overlay), Value-Area / outside / POC colours.
Levels: POC ray, VAH/VAL rays, optional Value-Area shading, ray extension, label size (Small → Huge).
Neon Candles: gradient candles (turquoise bullish / magenta bearish) with momentum-scaled glow halo.
Panel: show/hide, position, background and accent colour.
◆ ALERTS
Price crossed POC
Breakout above VAH
Breakdown below VAL
◆ NON-REPAINTING
The profile, levels and dashboard are single objects rendered on the last bar over a fixed rolling lookback — historical bars are never repainted. As with any live tool, the current bar is included in the calculation, so the real-time read updates tick by tick and settles on close; closed history never changes.
Smart Volume Profile VPVR is an educational analysis tool, not financial advice. Volume profile reflects historical traded volume and does not predict future prices. Always do your own research and manage risk. © LunqFX.
◆ WHY VOLUME PROFILE MATTERS
Most indicators are based on price and time. Volume profile is based on price and volume — it answers a completely different and more important question: at which prices did the most trading actually happen? Those prices are where institutions, liquidity and "fair value" concentrate. High-volume areas act as magnets and strong support/resistance; low-volume areas are vacuums that price rips through. By making this structure obvious, Smart Volume Profile helps you trade with the auction instead of against it.
◆ WHAT IT DRAWS ON THE CHART
POC — Point of Control (gold ray): the single most-traded price in the window. This is the market's fairest value and its strongest magnet. Price returns to the POC again and again; it is the most important pivot on the chart.
VAH / VAL — Value Area High & Low (dashed rays): the top and bottom of the zone that contains 70% of all traded volume (fully configurable, 40–95%). Inside this band the market is "comfortable"; outside it the market is in discovery / imbalance.
High Volume Nodes (HVN): thick, bright rows = heavy acceptance = strong support & resistance and reaction/reversal zones.
Low Volume Nodes (LVN): thin, dim rows = rejection / fast-move zones where price tends to travel quickly and gap.
Gradient histogram: every row is colour-graded by its volume, so the profile literally glows where volume is heaviest — you read the structure at a glance instead of squinting at bars.
All levels extend as live rays with clean, high-contrast labels showing the exact price.
◆ THE LIVE DASHBOARD PANEL (this is what makes it "Smart")
A plain volume profile just draws lines. This indicator adds a compact, modern analytics panel that computes context you cannot see on the chart and condenses it into one glance:
Signal — the headline call, colour-coded: ▲ LONG revert, ▼ SHORT revert, ▲ BREAKOUT, ▼ BREAKDOWN, or ● BALANCED. This is the playbook for the current moment (logic explained below).
→ POC — the live distance from current price to the Point of Control, in %. This is your mean-reversion target and a quick read of how stretched price is from fair value.
In VA — a clean segmented meter showing where price currently sits inside the value area (from VAL on the left to VAH on the right). Instantly tells you if you're at the top, middle, or bottom of value.
Acceptance — the split of volume traded above vs below the POC (e.g. 52% ▼ / ▲ 48%). Reveals which side the market is building value on — a directional bias the chart hides.
Pressure — a segmented meter of buy volume vs sell volume across the whole window. Shows whether buyers or sellers are in control of the auction.
Footer — the lookback size and the actual % of volume captured by the value area, so you always know the context behind the numbers.
The panel is fully themeable (position, background, accent) and stays readable on dark charts.
◆ HOW IT WORKS (under the hood)
Binning: the chosen lookback window is divided into price rows ("buckets"). Resolution is adjustable for coarse or razor-sharp profiles.
True volume distribution: instead of dumping each bar's volume at its close, the indicator can spread each bar's volume across every price it actually traded through (high→low), producing a far more accurate profile than close-only methods.
POC detection: the row with the maximum accumulated volume becomes the Point of Control — by construction always the longest bar in the histogram.
Value Area expansion: starting from the POC, the algorithm steps outward toward whichever neighbouring row holds more volume, accumulating until the target (default 70%) of total volume is enclosed. The final boundaries become VAH and VAL — the same methodology used in classic Market Profile.
Order-flow analytics: the script measures volume above vs below the POC (Acceptance) and buy-bar vs sell-bar volume (Pressure) across the window.
Smart Signal engine: it blends Acceptance and Pressure into a single order-flow reading and combines it with price location relative to the value area to classify the situation as a rotation or a breakout (see below).
◆ THE SMART SIGNAL LOGIC
A naive volume-profile tool always says "revert to POC", which gets you run over in trends. This one is smarter:
Price BELOW value + order flow NOT confirming the drop → ▲ LONG revert (rotation back to POC).
Price BELOW value + order flow confirming the drop → ▼ BREAKDOWN (continuation — don't catch the knife).
Price ABOVE value + order flow NOT confirming the push → ▼ SHORT revert (rotation back to POC).
Price ABOVE value + order flow confirming the push → ▲ BREAKOUT (continuation — trade with it).
Price INSIDE value → ● BALANCED (range conditions — fade the edges back toward POC).
This single distinction — rotation vs breakout — is the difference between fading a pullback and getting trapped against a trend.
◆ HOW TO USE IT
Mean-reversion / range trading: in BALANCED or revert states, fade moves at VAH/VAL back toward the POC. The → POC distance is your target; HVN rows are logical stop zones.
Breakout / trend trading: in BREAKOUT / BREAKDOWN states, trade in the direction of the move and target the next HVN. Avoid counter-trend fades when order flow confirms the break.
Support & resistance mapping: treat thick HVN rows as high-probability reaction zones and expect rapid, low-resistance moves through LVN gaps.
Bias & confluence: use Acceptance and Pressure for directional bias, and combine the POC/VAH/VAL levels with your own structure, liquidity, order blocks or session tools for higher-conviction entries.
Multi-timeframe: raise the Lookback for higher-timeframe value (swing context), lower it for intraday/scalping context. Increase Rows for more precise POC placement.
◆ SETTINGS
Volume Profile Engine: Lookback (bars), Rows (resolution), Value Area %, true-range volume distribution toggle.
Profile Look: width, gap from price, anchor side (right of price / classic overlay), Value-Area / outside / POC colours.
Levels: POC ray, VAH/VAL rays, optional Value-Area shading, ray extension, label size (Small → Huge).
Neon Candles: gradient candles (turquoise bullish / magenta bearish) with momentum-scaled glow halo.
Panel: show/hide, position, background and accent colour.
◆ ALERTS
Price crossed POC
Breakout above VAH
Breakdown below VAL
◆ NON-REPAINTING
The profile, levels and dashboard are single objects rendered on the last bar over a fixed rolling lookback — historical bars are never repainted. As with any live tool, the current bar is included in the calculation, so the real-time read updates tick by tick and settles on close; closed history never changes.
Smart Volume Profile VPVR is an educational analysis tool, not financial advice. Volume profile reflects historical traded volume and does not predict future prices. Always do your own research and manage risk. © LunqFX.
오픈 소스 스크립트
트레이딩뷰의 진정한 정신에 따라, 이 스크립트의 작성자는 이를 오픈소스로 공개하여 트레이더들이 기능을 검토하고 검증할 수 있도록 했습니다. 작성자에게 찬사를 보냅니다! 이 코드는 무료로 사용할 수 있지만, 코드를 재게시하는 경우 하우스 룰이 적용된다는 점을 기억하세요.

Trade setups with clear entry, stop, target and risk logic. Built for traders who want structure, not guessing.
💬 t.me/lunqfx
🌐 lunqfx.com
The same discipline, fully automated — NIGHT OWL:
🦉lunqfx.com/nightowl
💬 t.me/lunqfx
🌐 lunqfx.com
The same discipline, fully automated — NIGHT OWL:
🦉lunqfx.com/nightowl
면책사항
해당 정보와 게시물은 금융, 투자, 트레이딩 또는 기타 유형의 조언이나 권장 사항으로 간주되지 않으며, 트레이딩뷰에서 제공하거나 보증하는 것이 아닙니다. 자세한 내용은 이용 약관을 참조하세요.
오픈 소스 스크립트
트레이딩뷰의 진정한 정신에 따라, 이 스크립트의 작성자는 이를 오픈소스로 공개하여 트레이더들이 기능을 검토하고 검증할 수 있도록 했습니다. 작성자에게 찬사를 보냅니다! 이 코드는 무료로 사용할 수 있지만, 코드를 재게시하는 경우 하우스 룰이 적용된다는 점을 기억하세요.
Trade setups with clear entry, stop, target and risk logic. Built for traders who want structure, not guessing.
💬 t.me/lunqfx
🌐 lunqfx.com
The same discipline, fully automated — NIGHT OWL:
🦉lunqfx.com/nightowl
💬 t.me/lunqfx
🌐 lunqfx.com
The same discipline, fully automated — NIGHT OWL:
🦉lunqfx.com/nightowl
면책사항
해당 정보와 게시물은 금융, 투자, 트레이딩 또는 기타 유형의 조언이나 권장 사항으로 간주되지 않으며, 트레이딩뷰에서 제공하거나 보증하는 것이 아닙니다. 자세한 내용은 이용 약관을 참조하세요.