OPEN-SOURCE SCRIPT
CVD Simple vs Oscillator
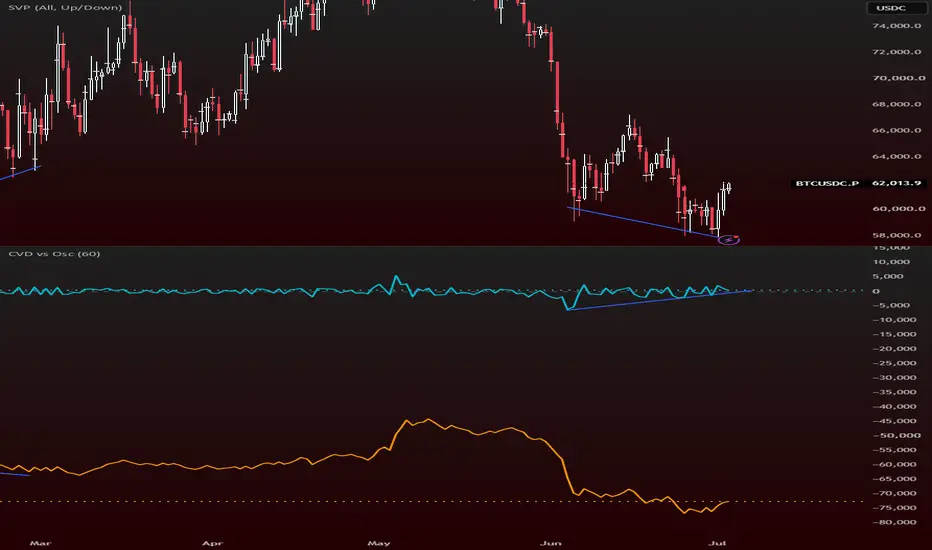
## CVD Simple vs Oscillator
This indicator displays **two versions** of Cumulative Volume Delta side by side for easy comparison:
- **Simple CVD** (Orange): A basic volume delta calculation using close vs open.
- **Oscillator** (Aqua): An advanced, smoother version calculated using intrabar data via TradingView’s `requestVolumeDelta()` function.
### Key Features
- Dual CVD visualization (Simple + Advanced)
- Daily reset by default (resets at the start of each new day)
- Manual vertical scaling enabled (`scale = scale.none`) — drag the right-side scale to stretch the lines
- Clean zero line for easy reference
- Lightweight and easy to read
### How to Use
**Simple CVD (Orange)**
A quick and basic representation of net buying vs selling pressure. It can appear spiky on high-volume bars.
**Oscillator (Aqua)**
A more accurate and smoother representation of cumulative order flow. This is generally the better line to follow for analysis.
### How to Read the Indicator
- **Above zero** → Net buying pressure is dominant
- **Below zero** → Net selling pressure is dominant
- **Rising line** → Buyers are gaining control
- **Falling line** → Sellers are gaining control
### Recommended Usage
- Use the **Oscillator** (Aqua) line for better signals
- Best used on **15m to Daily** timeframes
- Works well for identifying **divergences** between price and volume pressure
- Combine with price action and key support/resistance levels
### Settings
- **Reset Period**: Choose how often the CVD resets (Default = Daily)
- You can manually stretch the vertical scale by dragging the numbers on the right side of the pane
### Notes
This indicator helps traders visualize the ongoing battle between buyers and sellers through cumulative volume delta. The Oscillator version provides a cleaner view compared to basic delta calculations.
This indicator displays **two versions** of Cumulative Volume Delta side by side for easy comparison:
- **Simple CVD** (Orange): A basic volume delta calculation using close vs open.
- **Oscillator** (Aqua): An advanced, smoother version calculated using intrabar data via TradingView’s `requestVolumeDelta()` function.
### Key Features
- Dual CVD visualization (Simple + Advanced)
- Daily reset by default (resets at the start of each new day)
- Manual vertical scaling enabled (`scale = scale.none`) — drag the right-side scale to stretch the lines
- Clean zero line for easy reference
- Lightweight and easy to read
### How to Use
**Simple CVD (Orange)**
A quick and basic representation of net buying vs selling pressure. It can appear spiky on high-volume bars.
**Oscillator (Aqua)**
A more accurate and smoother representation of cumulative order flow. This is generally the better line to follow for analysis.
### How to Read the Indicator
- **Above zero** → Net buying pressure is dominant
- **Below zero** → Net selling pressure is dominant
- **Rising line** → Buyers are gaining control
- **Falling line** → Sellers are gaining control
### Recommended Usage
- Use the **Oscillator** (Aqua) line for better signals
- Best used on **15m to Daily** timeframes
- Works well for identifying **divergences** between price and volume pressure
- Combine with price action and key support/resistance levels
### Settings
- **Reset Period**: Choose how often the CVD resets (Default = Daily)
- You can manually stretch the vertical scale by dragging the numbers on the right side of the pane
### Notes
This indicator helps traders visualize the ongoing battle between buyers and sellers through cumulative volume delta. The Oscillator version provides a cleaner view compared to basic delta calculations.
오픈 소스 스크립트
트레이딩뷰의 진정한 정신에 따라, 이 스크립트의 작성자는 이를 오픈소스로 공개하여 트레이더들이 기능을 검토하고 검증할 수 있도록 했습니다. 작성자에게 찬사를 보냅니다! 이 코드는 무료로 사용할 수 있지만, 코드를 재게시하는 경우 하우스 룰이 적용된다는 점을 기억하세요.

면책사항
해당 정보와 게시물은 금융, 투자, 트레이딩 또는 기타 유형의 조언이나 권장 사항으로 간주되지 않으며, 트레이딩뷰에서 제공하거나 보증하는 것이 아닙니다. 자세한 내용은 이용 약관을 참조하세요.
오픈 소스 스크립트
트레이딩뷰의 진정한 정신에 따라, 이 스크립트의 작성자는 이를 오픈소스로 공개하여 트레이더들이 기능을 검토하고 검증할 수 있도록 했습니다. 작성자에게 찬사를 보냅니다! 이 코드는 무료로 사용할 수 있지만, 코드를 재게시하는 경우 하우스 룰이 적용된다는 점을 기억하세요.
면책사항
해당 정보와 게시물은 금융, 투자, 트레이딩 또는 기타 유형의 조언이나 권장 사항으로 간주되지 않으며, 트레이딩뷰에서 제공하거나 보증하는 것이 아닙니다. 자세한 내용은 이용 약관을 참조하세요.