OPEN-SOURCE SCRIPT
Neon 4 Stack EMAs
What it does
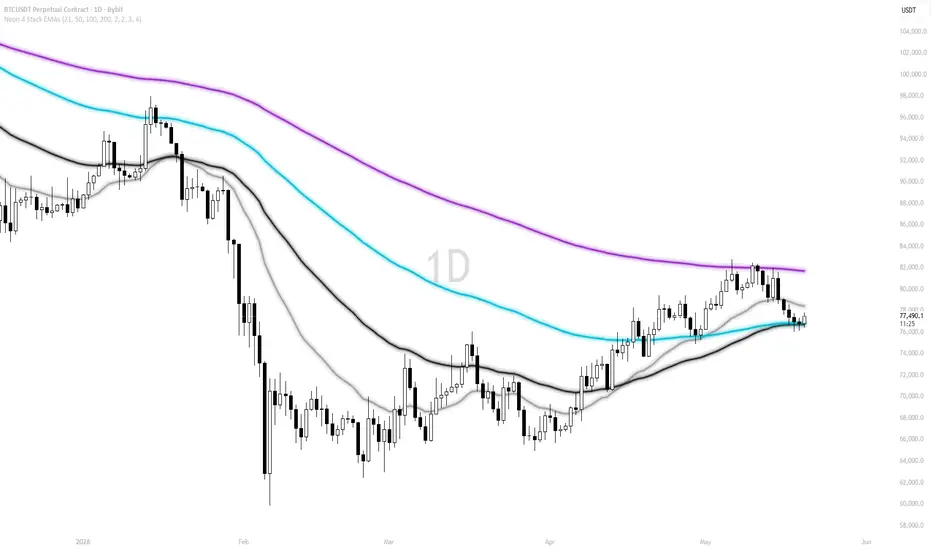
This tool plots four Exponential Moving Averages (EMAs) with a neon glow effect, designed to provide a clear multi-horizon structure on any symbol and timeframe. Each EMA is rendered with three glow layers plus a solid core line, creating a high-visibility aesthetic without sacrificing readability of price action.
How it works (method)
Each line is a standard EMA computed on the close price. The neon effect is achieved by stacking three transparent plots of decreasing width (outer, mid, inner) behind a solid core line, all sharing the same value — no visual offset or distortion.
Default periods and roles:
- EMA No 1 (21) – Grey: short-term reference
- EMA No 2 (50) – Black: intermediate reference
- EMA No 3 (100) – Cyan: medium-term reference
- EMA No 4 (200) – Purple: long-term bias and market context
Optional Crossover Color mode highlights whether EMA 1 is above or below EMA 2 (green/red). This is a visual aid only; it does not generate signals.
Originality & usefulness
The script combines a standard multi-horizon EMA stack with a neon glow rendering technique. It prioritizes clarity and control: fully customizable periods, colors, and thickness per EMA, with an optional crossover color mode. No opaque entry/exit logic is embedded.
Inputs & customization
- Periods: 21, 50, 100, 200 (all adjustable)
- Colors: fully customizable per EMA
- Thickness: set individually per EMA
- Crossover Color: optional visual mode for EMA 1 and EMA 2
- Glow layers: individually toggleable in the Style tab
Notes & limitations
- This script does not produce buy/sell signals or alerts.
- It is intended as a visual framework to support analysis.
- Always validate with your own rules, risk controls, and market conditions.
This tool plots four Exponential Moving Averages (EMAs) with a neon glow effect, designed to provide a clear multi-horizon structure on any symbol and timeframe. Each EMA is rendered with three glow layers plus a solid core line, creating a high-visibility aesthetic without sacrificing readability of price action.
How it works (method)
Each line is a standard EMA computed on the close price. The neon effect is achieved by stacking three transparent plots of decreasing width (outer, mid, inner) behind a solid core line, all sharing the same value — no visual offset or distortion.
Default periods and roles:
- EMA No 1 (21) – Grey: short-term reference
- EMA No 2 (50) – Black: intermediate reference
- EMA No 3 (100) – Cyan: medium-term reference
- EMA No 4 (200) – Purple: long-term bias and market context
Optional Crossover Color mode highlights whether EMA 1 is above or below EMA 2 (green/red). This is a visual aid only; it does not generate signals.
Originality & usefulness
The script combines a standard multi-horizon EMA stack with a neon glow rendering technique. It prioritizes clarity and control: fully customizable periods, colors, and thickness per EMA, with an optional crossover color mode. No opaque entry/exit logic is embedded.
Inputs & customization
- Periods: 21, 50, 100, 200 (all adjustable)
- Colors: fully customizable per EMA
- Thickness: set individually per EMA
- Crossover Color: optional visual mode for EMA 1 and EMA 2
- Glow layers: individually toggleable in the Style tab
Notes & limitations
- This script does not produce buy/sell signals or alerts.
- It is intended as a visual framework to support analysis.
- Always validate with your own rules, risk controls, and market conditions.
오픈 소스 스크립트
트레이딩뷰의 진정한 정신에 따라, 이 스크립트의 작성자는 이를 오픈소스로 공개하여 트레이더들이 기능을 검토하고 검증할 수 있도록 했습니다. 작성자에게 찬사를 보냅니다! 이 코드는 무료로 사용할 수 있지만, 코드를 재게시하는 경우 하우스 룰이 적용된다는 점을 기억하세요.

면책사항
해당 정보와 게시물은 금융, 투자, 트레이딩 또는 기타 유형의 조언이나 권장 사항으로 간주되지 않으며, 트레이딩뷰에서 제공하거나 보증하는 것이 아닙니다. 자세한 내용은 이용 약관을 참조하세요.
오픈 소스 스크립트
트레이딩뷰의 진정한 정신에 따라, 이 스크립트의 작성자는 이를 오픈소스로 공개하여 트레이더들이 기능을 검토하고 검증할 수 있도록 했습니다. 작성자에게 찬사를 보냅니다! 이 코드는 무료로 사용할 수 있지만, 코드를 재게시하는 경우 하우스 룰이 적용된다는 점을 기억하세요.
면책사항
해당 정보와 게시물은 금융, 투자, 트레이딩 또는 기타 유형의 조언이나 권장 사항으로 간주되지 않으며, 트레이딩뷰에서 제공하거나 보증하는 것이 아닙니다. 자세한 내용은 이용 약관을 참조하세요.