Profit zone trades High Volume Zones
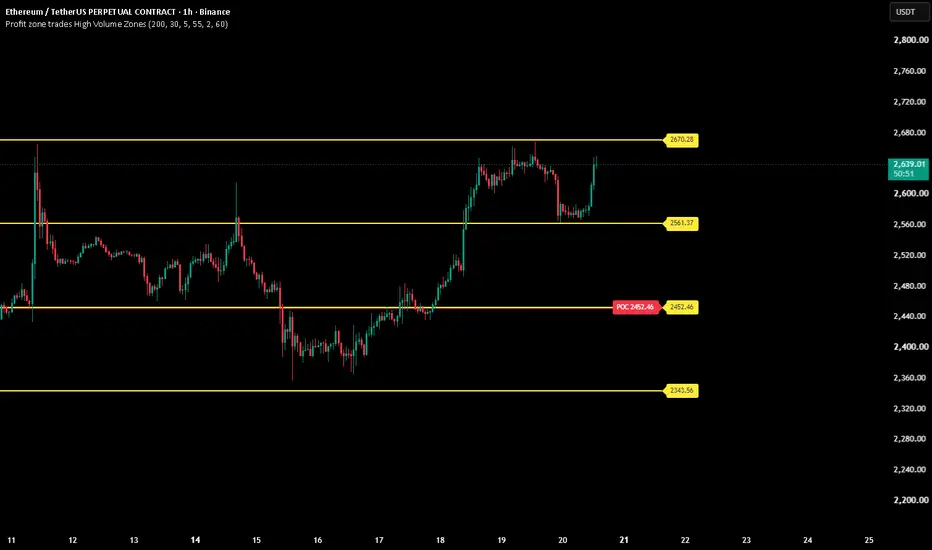
Profit Zone Trades High Volume Zones highlights the price levels that received the greatest concentration of volume within a selected historical window.
Rather than placing a full volume-profile histogram beside the chart, this indicator draws a concise set of horizontal reference levels directly on price. This keeps the chart readable while making the most active historical price areas easy to identify.
How it works
The script builds a simplified volume profile from the selected number of historical bars:
1. It finds the highest high and lowest low within the lookback period.
2. It splits that range into an adjustable number of equal price rows.
3. Each bar’s total volume is assigned to the row containing its closing price.
4. The script adds the volume in each row and ranks the rows from highest to lowest accumulated volume.
The highest-volume row is the Point of Control (POC), shown as a red horizontal line. The remaining top-ranked rows are shown as High-Volume Nodes (HVNs) using the selected line color.
These levels show where the largest amount of historical volume was concentrated in the sampled period. They may be useful for observing price interaction around historically active areas, including acceptance, rejection, consolidation, breakouts, and retests.
Using the indicator
- **Bars for volume profile:** Sets the historical window used in the calculation.
- **Number of rows:** Controls price resolution. Higher values create narrower price rows; lower values create broader rows.
- **Number of HVN zones to display:** Selects how many of the highest-volume rows are drawn.
- **Recalculate profile every X bars:** Sets how often the indicator rebuilds its profile and updates its levels.
- **Extend line right:** Extends the levels beyond the current bar for easier reference.
- **Show price label:** Displays the price of each level on the chart.
Using confluence
These historical volume levels can be used alongside other forms of chart analysis for additional context:
- Trend context from moving averages, VWAP, or market structure.
- Momentum context from RSI, MACD, or Stochastic RSI.
- Price-action confirmation from candles, swing highs and lows, breakouts, retests, and support/resistance.
- Participation context from standard volume bars or relative volume.
- Higher-timeframe reference levels such as previous day, week, or month highs and lows.
Confluence can help organize analysis, but no combination of indicators guarantees a price reaction or trade result.
Important limitations
This script is a simplified, bar-based volume profile. Each bar’s entire volume is assigned to the price row containing that bar’s close. It does not use intrabar, tick-by-tick, bid/ask, or exchange-native volume-at-price data.
The profile uses a rolling historical lookback and is rebuilt at the selected interval. As new bars enter the lookback window and older bars leave it, the calculated POC and HVN levels can change. Results also depend on the symbol’s available volume data, chart timeframe, and selected inputs.
The POC is the highest-volume row and may overlap with one of the displayed HVN lines.
This indicator is intended for educational and chart-analysis purposes only. It does not provide trading signals, predict future price direction, guarantee support or resistance, or constitute financial advice.
Rather than placing a full volume-profile histogram beside the chart, this indicator draws a concise set of horizontal reference levels directly on price. This keeps the chart readable while making the most active historical price areas easy to identify.
How it works
The script builds a simplified volume profile from the selected number of historical bars:
1. It finds the highest high and lowest low within the lookback period.
2. It splits that range into an adjustable number of equal price rows.
3. Each bar’s total volume is assigned to the row containing its closing price.
4. The script adds the volume in each row and ranks the rows from highest to lowest accumulated volume.
The highest-volume row is the Point of Control (POC), shown as a red horizontal line. The remaining top-ranked rows are shown as High-Volume Nodes (HVNs) using the selected line color.
These levels show where the largest amount of historical volume was concentrated in the sampled period. They may be useful for observing price interaction around historically active areas, including acceptance, rejection, consolidation, breakouts, and retests.
Using the indicator
- **Bars for volume profile:** Sets the historical window used in the calculation.
- **Number of rows:** Controls price resolution. Higher values create narrower price rows; lower values create broader rows.
- **Number of HVN zones to display:** Selects how many of the highest-volume rows are drawn.
- **Recalculate profile every X bars:** Sets how often the indicator rebuilds its profile and updates its levels.
- **Extend line right:** Extends the levels beyond the current bar for easier reference.
- **Show price label:** Displays the price of each level on the chart.
Using confluence
These historical volume levels can be used alongside other forms of chart analysis for additional context:
- Trend context from moving averages, VWAP, or market structure.
- Momentum context from RSI, MACD, or Stochastic RSI.
- Price-action confirmation from candles, swing highs and lows, breakouts, retests, and support/resistance.
- Participation context from standard volume bars or relative volume.
- Higher-timeframe reference levels such as previous day, week, or month highs and lows.
Confluence can help organize analysis, but no combination of indicators guarantees a price reaction or trade result.
Important limitations
This script is a simplified, bar-based volume profile. Each bar’s entire volume is assigned to the price row containing that bar’s close. It does not use intrabar, tick-by-tick, bid/ask, or exchange-native volume-at-price data.
The profile uses a rolling historical lookback and is rebuilt at the selected interval. As new bars enter the lookback window and older bars leave it, the calculated POC and HVN levels can change. Results also depend on the symbol’s available volume data, chart timeframe, and selected inputs.
The POC is the highest-volume row and may overlap with one of the displayed HVN lines.
This indicator is intended for educational and chart-analysis purposes only. It does not provide trading signals, predict future price direction, guarantee support or resistance, or constitute financial advice.

면책사항
해당 정보와 게시물은 금융, 투자, 트레이딩 또는 기타 유형의 조언이나 권장 사항으로 간주되지 않으며, 트레이딩뷰에서 제공하거나 보증하는 것이 아닙니다. 자세한 내용은 이용 약관을 참조하세요.
면책사항
해당 정보와 게시물은 금융, 투자, 트레이딩 또는 기타 유형의 조언이나 권장 사항으로 간주되지 않으며, 트레이딩뷰에서 제공하거나 보증하는 것이 아닙니다. 자세한 내용은 이용 약관을 참조하세요.