OPEN-SOURCE SCRIPT
업데이트됨 Implied vs Realized Volatility (IV vs RV)
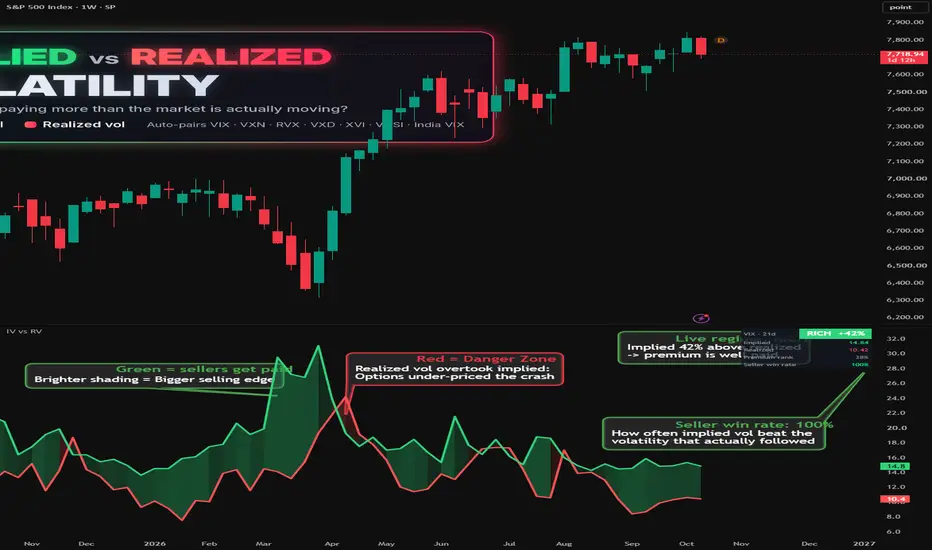
Are options paying more than the market is actually moving?
This indicator plots implied volatility (what the options market is pricing) against realized volatility (what the market is actually delivering), on the same scale, so you can see at a glance whether option premium is rich or thin.
WHAT IT SHOWS
- Green line: Implied volatility, the live vol index (e.g. VIX for the S&P 500).
- Red line: Realized volatility, how much the underlying index has really been moving over the same horizon.
- Shading between the lines: green when implied is above realized (options are pricing more movement than is happening), red when realized is above implied (the market is moving more than options are paying for). The bigger the gap, the brighter the shading.
THE TABLE
- Regime: RICH / FAIR / THIN / NEGATIVE, with the % implied is above or below realized (e.g. RICH +42%).
- Implied and Realized: the live values.
- Premium rank: where today's gap sits compared with the recent past (3M / 6M / 1Y). High = unusually fat premium.
- Seller win rate: over the last 21 days, how often the implied vol that was priced turned out higher than the volatility that actually followed. A reality check on whether premium has really been overpriced lately.
AUTO-PAIRING
Add it to a chart and it picks the right pair automatically. It works on the index, its main ETFs, futures and CFDs:
- S&P 500 (SPX, SPY, ES, US500): VIX
- Nasdaq 100 (NDX, QQQ, NQ): VXN
- Russell 2000 (RUT, IWM, RTY): RVX
- Dow Jones (DJI, DIA, YM): VXD
- ASX 200 (XJO, SPI futures, AUS200): XVI
- Hang Seng: VHSI · Nifty 50: India VIX
You can also choose a market manually, including VIX9D, VIX3M and VIX6M. The realized vol window adjusts automatically to match (e.g. VIX9D compares against roughly 9 days of realized vol, VIX against 21 trading days). Any other pair can be set under Custom.
HOW IT'S CALCULATED
Realized vol is close-to-close volatility of the underlying index, annualized to the same units as the vol index (zero-mean, the same convention used for variance swaps). It's built from completed daily closes plus today's live price, so it updates through the session and reads the same on any timeframe, from 1H to weekly. No repainting.
WHO IT'S FOR
- Option sellers: sell premium when it's rich, be careful when it's thin or negative.
- Option buyers: spot when protection is relatively cheap.
- Anyone wanting a quick read on whether the market is calmer or wilder than options expect.
NOTES
Implied and realized vol measure the size of moves, not their direction. A slow, steady trend can stay "low vol" while still travelling a long way, so use this alongside your own risk management. For educational purposes only, not financial advice.
릴리즈 노트
v1.1릴리즈 노트
v1.2오픈 소스 스크립트
트레이딩뷰의 진정한 정신에 따라, 이 스크립트의 작성자는 이를 오픈소스로 공개하여 트레이더들이 기능을 검토하고 검증할 수 있도록 했습니다. 작성자에게 찬사를 보냅니다! 이 코드는 무료로 사용할 수 있지만, 코드를 재게시하는 경우 하우스 룰이 적용된다는 점을 기억하세요.

면책사항
해당 정보와 게시물은 금융, 투자, 트레이딩 또는 기타 유형의 조언이나 권장 사항으로 간주되지 않으며, 트레이딩뷰에서 제공하거나 보증하는 것이 아닙니다. 자세한 내용은 이용 약관을 참조하세요.
오픈 소스 스크립트
트레이딩뷰의 진정한 정신에 따라, 이 스크립트의 작성자는 이를 오픈소스로 공개하여 트레이더들이 기능을 검토하고 검증할 수 있도록 했습니다. 작성자에게 찬사를 보냅니다! 이 코드는 무료로 사용할 수 있지만, 코드를 재게시하는 경우 하우스 룰이 적용된다는 점을 기억하세요.
면책사항
해당 정보와 게시물은 금융, 투자, 트레이딩 또는 기타 유형의 조언이나 권장 사항으로 간주되지 않으며, 트레이딩뷰에서 제공하거나 보증하는 것이 아닙니다. 자세한 내용은 이용 약관을 참조하세요.