OPEN-SOURCE SCRIPT
Option Premium Chart - Key Levels
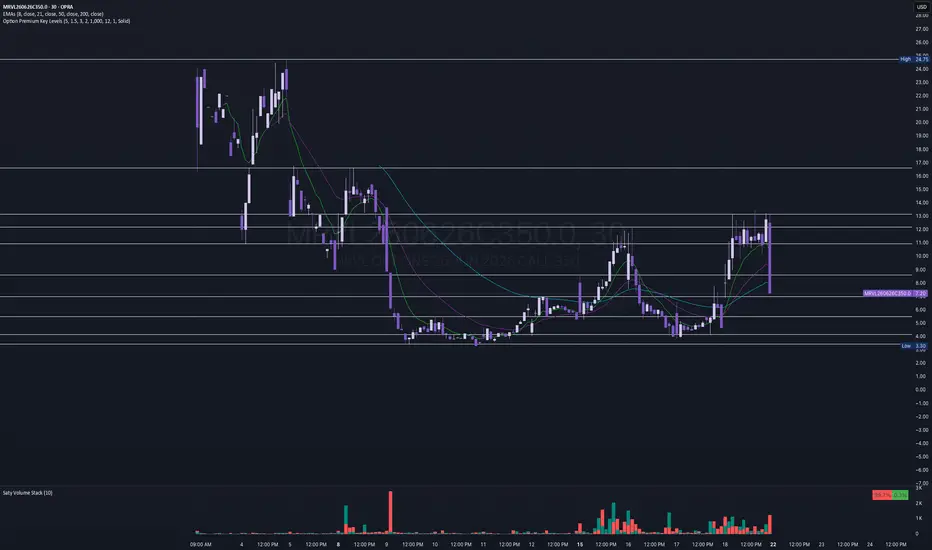
This indicator is made to draw lines on an options contract's premium chart to show key levels the premium may support or resist at. Similar to a normal stock chart, use these levels to analyze at what price to enter, what price to set a stop loss, and what price to target.
The settings have been optimized to detect areas that candle bodies and stems touch multiple times and on a chart with minimal bar history. Typical stocks may have more candle history, but an option contract's chart has less bars and needs to be adjusted to read it differently.
The settings have been optimized to detect areas that candle bodies and stems touch multiple times and on a chart with minimal bar history. Typical stocks may have more candle history, but an option contract's chart has less bars and needs to be adjusted to read it differently.
오픈 소스 스크립트
트레이딩뷰의 진정한 정신에 따라, 이 스크립트의 작성자는 이를 오픈소스로 공개하여 트레이더들이 기능을 검토하고 검증할 수 있도록 했습니다. 작성자에게 찬사를 보냅니다! 이 코드는 무료로 사용할 수 있지만, 코드를 재게시하는 경우 하우스 룰이 적용된다는 점을 기억하세요.

면책사항
해당 정보와 게시물은 금융, 투자, 트레이딩 또는 기타 유형의 조언이나 권장 사항으로 간주되지 않으며, 트레이딩뷰에서 제공하거나 보증하는 것이 아닙니다. 자세한 내용은 이용 약관을 참조하세요.
오픈 소스 스크립트
트레이딩뷰의 진정한 정신에 따라, 이 스크립트의 작성자는 이를 오픈소스로 공개하여 트레이더들이 기능을 검토하고 검증할 수 있도록 했습니다. 작성자에게 찬사를 보냅니다! 이 코드는 무료로 사용할 수 있지만, 코드를 재게시하는 경우 하우스 룰이 적용된다는 점을 기억하세요.
면책사항
해당 정보와 게시물은 금융, 투자, 트레이딩 또는 기타 유형의 조언이나 권장 사항으로 간주되지 않으며, 트레이딩뷰에서 제공하거나 보증하는 것이 아닙니다. 자세한 내용은 이용 약관을 참조하세요.