업데이트됨
Range Break Signals [AR]
What it does
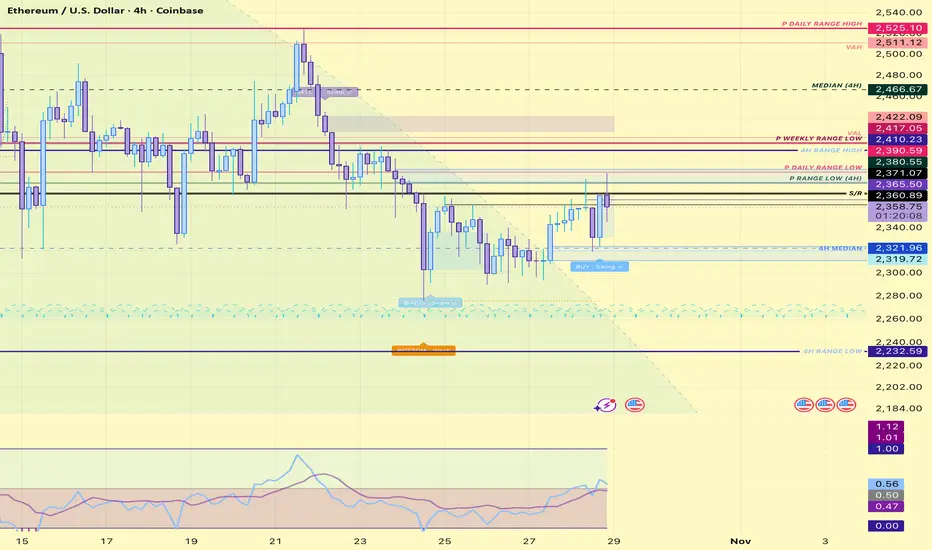
This indicator finds periods where price is ranging, then prints a signal when a candle body closes outside that range:
BUY: a body closes above the range top.
SELL: a body closes below the range low.
Signals only print on confirmed candle closes, so they don’t repaint. Wicks that poke through the range and close back inside are ignored.
How it works
Range detection: the script looks back a set number of bars and measures the highest and lowest candle bodies (or wicks, if you choose). If that range is tight relative to ATR, it’s locked in as an active range.
Breakout trigger: a body close beyond the range top or low prints the signal.
Invalidation: after a break, the setup is only cancelled by a body close back beyond a set fib level of the range (0.5 by default). The range then re-arms, so a failed break can turn into a signal in the other direction.
Quality filters (optional)
Each filter can be switched on or off. Breaks that fail a filter are shown as small grey markers, so you can see what was skipped.
Minimum bars in range: longer ranges produce more reliable breaks (on by default).
Breakout strength: the trigger candle’s body must be at least a set multiple of ATR.
Volume: breakout volume must beat its average by a set factor.
Trend filter: BUY only above an EMA or the Ichimoku cloud, SELL only below.
Minimum range width: ignores very small ranges.
External confirmation: requires a value from another indicator’s plot within a set number of bars.
How to use it
The strongest signals come from confluence. A break carries the most weight when it:
Clears a key support or resistance level, such as a prior range edge or a higher-timeframe level.
Agrees with momentum or other confirmation tools you already use.
A signal on its own is information. A signal at a key level, with confirmation, is a setup. Wait for the body close, plan your entry on the retest, and set your invalidation where the range would be reclaimed, not on a wick.
Settings
Lookback, ATR length, maximum range width, body or wick range edges, invalidation fib, all six filters, and fully adjustable signal colours, size and style (label, triangle or arrow).
Alerts
BUY and SELL alert conditions are included. Right-click the indicator and choose “Add alert”.
For educational purposes only. Not financial advice.
This indicator finds periods where price is ranging, then prints a signal when a candle body closes outside that range:
BUY: a body closes above the range top.
SELL: a body closes below the range low.
Signals only print on confirmed candle closes, so they don’t repaint. Wicks that poke through the range and close back inside are ignored.
How it works
Range detection: the script looks back a set number of bars and measures the highest and lowest candle bodies (or wicks, if you choose). If that range is tight relative to ATR, it’s locked in as an active range.
Breakout trigger: a body close beyond the range top or low prints the signal.
Invalidation: after a break, the setup is only cancelled by a body close back beyond a set fib level of the range (0.5 by default). The range then re-arms, so a failed break can turn into a signal in the other direction.
Quality filters (optional)
Each filter can be switched on or off. Breaks that fail a filter are shown as small grey markers, so you can see what was skipped.
Minimum bars in range: longer ranges produce more reliable breaks (on by default).
Breakout strength: the trigger candle’s body must be at least a set multiple of ATR.
Volume: breakout volume must beat its average by a set factor.
Trend filter: BUY only above an EMA or the Ichimoku cloud, SELL only below.
Minimum range width: ignores very small ranges.
External confirmation: requires a value from another indicator’s plot within a set number of bars.
How to use it
The strongest signals come from confluence. A break carries the most weight when it:
Clears a key support or resistance level, such as a prior range edge or a higher-timeframe level.
Agrees with momentum or other confirmation tools you already use.
A signal on its own is information. A signal at a key level, with confirmation, is a setup. Wait for the body close, plan your entry on the retest, and set your invalidation where the range would be reclaimed, not on a wick.
Settings
Lookback, ATR length, maximum range width, body or wick range edges, invalidation fib, all six filters, and fully adjustable signal colours, size and style (label, triangle or arrow).
Alerts
BUY and SELL alert conditions are included. Right-click the indicator and choose “Add alert”.
For educational purposes only. Not financial advice.
릴리즈 노트
Reclaims now print. When a breakout fails and a body closes back inside the range, RBS fires the opposite signal (SELL ↺ / BUY ↺).Some of the strongest prints on the chart. Trapped breakout traders are the fuel.
릴리즈 노트
Scalps and swings added to help determine if it's a long or short term trade.릴리즈 노트
Update: Swing / Scalp tags and volume confirmationSwing / Scalp
Every BUY, SELL and reclaim (↺) is now tagged Swing or Scalp. Hover a label to see why.
· Five checks: higher-timeframe trend, room to the next HTF level, length of the base, volatility squeeze, impulse candle. Three or more, with the HTF trend agreeing, makes a Swing.
· A signal at the higher-timeframe range high or low is a Swing, unless the trend is against it.
· A break out of a long range (2× the lookback) is a Swing.
· A signal while the higher-timeframe RSI is deeply oversold or overbought (30 / 70) is a Swing.
· Exhaustion guard: an oversized body, price stretched far from the Kijun, or a long wick against the signal shows Scalp ⚠.
· New alerts for Swing-only signals.
Volume confirmation (✓ / ✓✓)
Signals are graded by how much volume backs them.
· Volume profile: on a break, the range’s point of control sits in the half price broke out of. On a reclaim, the body closes back inside the value area.
· CVD: buy minus sell volume on the signal candle agrees with the direction and is at least the average.
· ✓✓ means both agree, ✓ means one does, and no tick means neither. It is judged on the signal candle itself, so it never repaints.
· Optional: draw the POC and value area on each signal.
· New alerts for ✓✓ BUY and SELL.
Other
· Ranges on 1D / 1W / 1M now use a 12-bar lookback.
· Flip mode is on by default. On a reclaim, the failed signal is removed and the opposite signal prints (BUY ↺ / SELL ↺).
Wicks lie. Bodies don’t.
릴리즈 노트
...릴리즈 노트
.릴리즈 노트
Update: Signal candle zonesThe body of every BUY, SELL and reclaim (↺) candle is now boxed as a retest zone.
· The signal candle’s body is where the move started, so it often acts as support (BUY) or resistance (SELL) on the retest.
· The box extends right until a candle body closes through it, then stops. Wicks into the zone don’t end it.
· On a flip, the failed signal’s zone is removed together with its label, and the reclaim candle gets its own zone.
· Only reacts to closed candles, so nothing repaints.
· Settings: new “Signal candle zone” group. Turn it on or off, set how long a zone extends (default 60 bars) and choose the colours.
A practical use: set limit orders inside the zone for the retest instead of chasing the signal candle.
Wicks lie. Bodies don’t.
릴리즈 노트
RBS now marks the candle where a move ran out of steam.· A candle is exhausted when at least 3 of 4 signs line up: stretched (3+ ATR from the Kijun, or a wick past the range edge), RSI overheated (70+ / 30 or below), a rejection wick of at least 40% of the candle, and climax volume (2× the average).
· It must be the extreme of the last 10 candles.
· Confirmed only when the next candle closes its body back past the middle of the exhausted candle’s body. The marker then prints on the exhausted candle: navy TOP or orange BOTTOM. One candle late, never repaints.
· Hover a marker to see which signs fired.
· Settings: new “Exhaustion tops / bottoms” group. Every threshold is adjustable.
· New alerts: TOP and BOTTOM (confirmed).
How to use it: TOP / BOTTOM marks the turn, and a reclaim (SELL ↺ / BUY ↺) is the entry.
Wicks lie. Bodies don’t.
릴리즈 노트
.릴리즈 노트
.릴리즈 노트
.릴리즈 노트
.
면책사항
해당 정보와 게시물은 금융, 투자, 트레이딩 또는 기타 유형의 조언이나 권장 사항으로 간주되지 않으며, 트레이딩뷰에서 제공하거나 보증하는 것이 아닙니다. 자세한 내용은 이용 약관을 참조하세요.
면책사항
해당 정보와 게시물은 금융, 투자, 트레이딩 또는 기타 유형의 조언이나 권장 사항으로 간주되지 않으며, 트레이딩뷰에서 제공하거나 보증하는 것이 아닙니다. 자세한 내용은 이용 약관을 참조하세요.