Expected Move Cone + Range Forecast [Rider Algo]
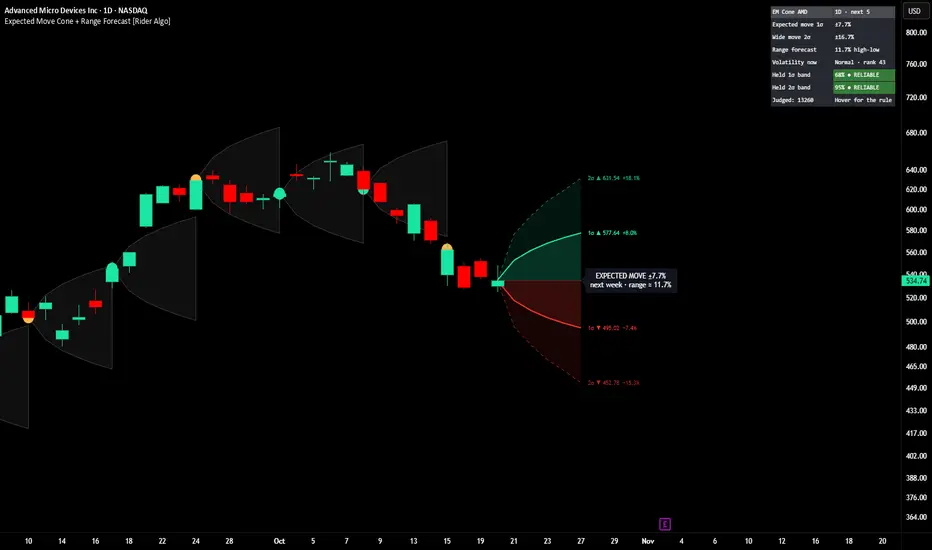
How far can price travel by next week, up or down? This indicator draws the answer as a cone that opens to the right of the last closed candle: the inner band is where the close usually lands, the outer band is where an unusual move begins. Think of the hurricane cone on a weather map: it does not tell you which way the storm will turn, it tells you how wide its path can get.
Options traders call the inner band the "expected move". Here it is measured from the chart's own history, so it works on crypto, forex, stocks, indexes and futures, with no options data needed.
═══════════════════════════════════════════════════════════════════════════
HOW IT WORKS
1. Volatility that remembers. The script blends a fast and a slow average of recent price swings (EWMA 0.94 and 0.99, 50/50). The fast part reacts to the last days; the slow part remembers what is normal for this asset. A fast-only measure makes cones too narrow after a quiet week and too wide after a wild one; the blend corrects both.
2. Shape learned from this chart. Every past close is turned into one number: how many volatility units price moved N candles later. The bands are percentiles of those moves (68% and 95% by default). Real markets have fat tails, and a textbook bell-curve cone underestimates them; here the tails come from the asset itself.
3. Up and down are mirrored. The cone measures HOW MUCH price moves, never WHICH WAY.
4. Range forecast. The same method applied to the distance between the highest high and the lowest low of the next N candles: how much ground price usually covers, wicks included.
5. Fixed at the close. Everything starts from the last CLOSED candle and uses only data known at that close. The live candle walks inside the cone; nothing moves until the candle closes.
═══════════════════════════════════════════════════════════════════════════
WHAT YOU SEE ON THE CHART
The cone
- Inner band (1σ): the close N candles later ended inside it 68% of the time. Green above the price, red below.
- Outer band (2σ, dashed edge): 95% of the time. A close beyond it is an unusual move.
- Price labels at the end of each edge, with the % change from the last close.
- Dotted line: the last close, for reference. It is not a forecast of direction.
The badge
"EXPECTED MOVE ±X%", the horizon in words (next day, next week, next month) and the range forecast. This is the one number to read first.
Past cones (the honesty check)
Faded cones behind the price, each one made at its own close with only the data known then. A dot marks where the close ended:
- Green: inside the inner band.
- Amber: inside the outer band.
- Red: broke out.
Hover a dot to see the cone's size and the real move. You can see for yourself how often price stayed inside, instead of trusting a promise.
The table
- Expected move 1σ and Wide move 2σ in %, with the exact prices in the tooltips.
- Range forecast: the typical high-to-low distance of the next N candles, and how big it gets 1 time in 5.
- Volatility now: Quiet, Normal or Wild, ranked against the last 365 candles.
- Held 1σ band / Held 2σ band: every closed candle's cone on this chart is checked N candles later. The share that ended inside is compared with its promise and gets a verdict: RELIABLE (close to the promise), MIXED or NOT RELIABLE (this market is moving more, or less, than its own history says). Below 100 judged cones it says NOT ENOUGH DATA.
═══════════════════════════════════════════════════════════════════════════
HOW TO USE IT
1. Read the badge: how big is a normal move over the horizon you trade?
2. Check the verdict in the table. If it says RELIABLE, the bands have kept their promise on this chart; if not, give them extra room.
3. Stops: a stop inside the inner band sits in normal noise. Traders often place stops beyond the inner edge, or size the position so that a move to the outer edge is an acceptable loss.
4. Targets: a target beyond the outer band needs an unusual move within the horizon. The range forecast tells you how much ground price usually covers, which helps judge a take-profit or a grid width.
5. Options and premium selling: the edges are a starting point for strikes and for judging whether a straddle or a strangle is priced above or below what this asset usually moves.
When the cone is in a squeeze (Volatility now = Quiet), a small cone means small moves are normal right now; it does not say when the quiet ends. Pair it with a direction tool before acting.
═══════════════════════════════════════════════════════════════════════════
INPUTS
1 · Cone
- Candles ahead: Auto (default) uses one period of the next timeframe up, counted on your chart: 1D shows the next week (7 candles on crypto, 5 on stocks), 4H the next day on crypto or the next week on stocks, 1H the next day, 1W the next month, 15m the next 4 hours, 5m the next hour. Custom: 2 to 60 candles.
- Inner band (%) (default 68) and Outer band (%) (default 95). 50 / 80 is a tighter alternative.
- History to learn from (default 2,000 candles). The cone needs about 320 candles to start.
2 · Look
- Show outer band, Show price labels, Show expected move badge and the Up / Down colors.
3 · Past cones
- Show past cones and How many (default 8).
4 · Table
- Position and Size.
- Judge the last N candles (0 = every cone on the chart).
- Cones needed for a verdict (default 100) and Reliable within ± points (default 5 for the inner band, 2.5 for the outer band; MIXED is twice that).
═══════════════════════════════════════════════════════════════════════════
BUILT-IN ALERTS
- Unusual candle (beyond the outer band): a single candle moved more than the outer band allows for one candle.
- Volatility squeeze: the expected move entered the narrowest 10% of the last 365 candles.
- Any alert() function call: at every candle close, a ready-to-read message with the expected move, both bands in prices and the range forecast. Useful for webhooks and chat bots.
═══════════════════════════════════════════════════════════════════════════
TECHNICAL NOTES
- Pine Script v6, overlay, no request.security calls.
- Non-repainting: the cone, the past cones and the track record use closed candles only. The live candle does not change any level.
- Percentiles are exact at up to 15 points of the cone and interpolated in between; a band never gets narrower further out.
- The track record keeps a sorted window of past moves, so every cone on the chart is judged with only what was known at its close.
- Prices are handled in log terms, so the upper edge is a little farther in % than the lower edge, as compounding requires.
- Volatility has a floor of one tick, so flat candles in old history cannot distort the bands.
What makes it original
The volatility cone itself is a well-known idea: options desks have drawn expected moves that widen with the square root of time for decades. The code here is our own, and so are the parts that make it practical: band shapes taken from each asset's own history in units of a fast-plus-slow volatility blend, the range forecast, the automatic horizon in calendar words, the past cones drawn on the chart, and a table that grades the bands against their own promise on the chart you are looking at.
═══════════════════════════════════════════════════════════════════════════
PART OF THE RIDER ALGO ECOSYSTEM
- Use with Probability Clouds + Entry Level [Rider Algo]: the clouds ask WHERE price may close and touch after moments like today; the cone asks HOW MUCH price usually moves. Same family, two questions.
- Use with Compression Box + Breakout Plan [Rider Algo] when the cone is in a squeeze: the box gives the levels where a quiet market tends to break out.
- Use with Rider Algo #2: Trend Detection for direction, then let the cone size the stop and judge the target.
- Use with Strategy #1 - Sudden Moves towards Optimizer Lines [Rider Algo] and Buy Zone Planner [Rider Algo] to see whether a limit order sits inside the move price usually makes over your time frame.
If the cone helps your planning, a boost and a follow let us know which tools to build next.
═══════════════════════════════════════════════════════════════════════════
DISCLAIMER
This indicator is a technical analysis tool designed to estimate how far price usually moves over the next candles, from a chart's own history. It does NOT provide buy or sell signals, and it does NOT constitute financial, investment, or trading advice of any kind. Past patterns do not guarantee future market behavior. Always conduct your own analysis and consult with a qualified financial advisor before making any trading decisions. Use this tool at your own risk. The author is not responsible for any financial losses incurred from the use of this indicator.
Options traders call the inner band the "expected move". Here it is measured from the chart's own history, so it works on crypto, forex, stocks, indexes and futures, with no options data needed.
═══════════════════════════════════════════════════════════════════════════
HOW IT WORKS
1. Volatility that remembers. The script blends a fast and a slow average of recent price swings (EWMA 0.94 and 0.99, 50/50). The fast part reacts to the last days; the slow part remembers what is normal for this asset. A fast-only measure makes cones too narrow after a quiet week and too wide after a wild one; the blend corrects both.
2. Shape learned from this chart. Every past close is turned into one number: how many volatility units price moved N candles later. The bands are percentiles of those moves (68% and 95% by default). Real markets have fat tails, and a textbook bell-curve cone underestimates them; here the tails come from the asset itself.
3. Up and down are mirrored. The cone measures HOW MUCH price moves, never WHICH WAY.
4. Range forecast. The same method applied to the distance between the highest high and the lowest low of the next N candles: how much ground price usually covers, wicks included.
5. Fixed at the close. Everything starts from the last CLOSED candle and uses only data known at that close. The live candle walks inside the cone; nothing moves until the candle closes.
═══════════════════════════════════════════════════════════════════════════
WHAT YOU SEE ON THE CHART
The cone
- Inner band (1σ): the close N candles later ended inside it 68% of the time. Green above the price, red below.
- Outer band (2σ, dashed edge): 95% of the time. A close beyond it is an unusual move.
- Price labels at the end of each edge, with the % change from the last close.
- Dotted line: the last close, for reference. It is not a forecast of direction.
The badge
"EXPECTED MOVE ±X%", the horizon in words (next day, next week, next month) and the range forecast. This is the one number to read first.
Past cones (the honesty check)
Faded cones behind the price, each one made at its own close with only the data known then. A dot marks where the close ended:
- Green: inside the inner band.
- Amber: inside the outer band.
- Red: broke out.
Hover a dot to see the cone's size and the real move. You can see for yourself how often price stayed inside, instead of trusting a promise.
The table
- Expected move 1σ and Wide move 2σ in %, with the exact prices in the tooltips.
- Range forecast: the typical high-to-low distance of the next N candles, and how big it gets 1 time in 5.
- Volatility now: Quiet, Normal or Wild, ranked against the last 365 candles.
- Held 1σ band / Held 2σ band: every closed candle's cone on this chart is checked N candles later. The share that ended inside is compared with its promise and gets a verdict: RELIABLE (close to the promise), MIXED or NOT RELIABLE (this market is moving more, or less, than its own history says). Below 100 judged cones it says NOT ENOUGH DATA.
═══════════════════════════════════════════════════════════════════════════
HOW TO USE IT
1. Read the badge: how big is a normal move over the horizon you trade?
2. Check the verdict in the table. If it says RELIABLE, the bands have kept their promise on this chart; if not, give them extra room.
3. Stops: a stop inside the inner band sits in normal noise. Traders often place stops beyond the inner edge, or size the position so that a move to the outer edge is an acceptable loss.
4. Targets: a target beyond the outer band needs an unusual move within the horizon. The range forecast tells you how much ground price usually covers, which helps judge a take-profit or a grid width.
5. Options and premium selling: the edges are a starting point for strikes and for judging whether a straddle or a strangle is priced above or below what this asset usually moves.
When the cone is in a squeeze (Volatility now = Quiet), a small cone means small moves are normal right now; it does not say when the quiet ends. Pair it with a direction tool before acting.
═══════════════════════════════════════════════════════════════════════════
INPUTS
1 · Cone
- Candles ahead: Auto (default) uses one period of the next timeframe up, counted on your chart: 1D shows the next week (7 candles on crypto, 5 on stocks), 4H the next day on crypto or the next week on stocks, 1H the next day, 1W the next month, 15m the next 4 hours, 5m the next hour. Custom: 2 to 60 candles.
- Inner band (%) (default 68) and Outer band (%) (default 95). 50 / 80 is a tighter alternative.
- History to learn from (default 2,000 candles). The cone needs about 320 candles to start.
2 · Look
- Show outer band, Show price labels, Show expected move badge and the Up / Down colors.
3 · Past cones
- Show past cones and How many (default 8).
4 · Table
- Position and Size.
- Judge the last N candles (0 = every cone on the chart).
- Cones needed for a verdict (default 100) and Reliable within ± points (default 5 for the inner band, 2.5 for the outer band; MIXED is twice that).
═══════════════════════════════════════════════════════════════════════════
BUILT-IN ALERTS
- Unusual candle (beyond the outer band): a single candle moved more than the outer band allows for one candle.
- Volatility squeeze: the expected move entered the narrowest 10% of the last 365 candles.
- Any alert() function call: at every candle close, a ready-to-read message with the expected move, both bands in prices and the range forecast. Useful for webhooks and chat bots.
═══════════════════════════════════════════════════════════════════════════
TECHNICAL NOTES
- Pine Script v6, overlay, no request.security calls.
- Non-repainting: the cone, the past cones and the track record use closed candles only. The live candle does not change any level.
- Percentiles are exact at up to 15 points of the cone and interpolated in between; a band never gets narrower further out.
- The track record keeps a sorted window of past moves, so every cone on the chart is judged with only what was known at its close.
- Prices are handled in log terms, so the upper edge is a little farther in % than the lower edge, as compounding requires.
- Volatility has a floor of one tick, so flat candles in old history cannot distort the bands.
What makes it original
The volatility cone itself is a well-known idea: options desks have drawn expected moves that widen with the square root of time for decades. The code here is our own, and so are the parts that make it practical: band shapes taken from each asset's own history in units of a fast-plus-slow volatility blend, the range forecast, the automatic horizon in calendar words, the past cones drawn on the chart, and a table that grades the bands against their own promise on the chart you are looking at.
═══════════════════════════════════════════════════════════════════════════
PART OF THE RIDER ALGO ECOSYSTEM
- Use with Probability Clouds + Entry Level [Rider Algo]: the clouds ask WHERE price may close and touch after moments like today; the cone asks HOW MUCH price usually moves. Same family, two questions.
- Use with Compression Box + Breakout Plan [Rider Algo] when the cone is in a squeeze: the box gives the levels where a quiet market tends to break out.
- Use with Rider Algo #2: Trend Detection for direction, then let the cone size the stop and judge the target.
- Use with Strategy #1 - Sudden Moves towards Optimizer Lines [Rider Algo] and Buy Zone Planner [Rider Algo] to see whether a limit order sits inside the move price usually makes over your time frame.
If the cone helps your planning, a boost and a follow let us know which tools to build next.
═══════════════════════════════════════════════════════════════════════════
DISCLAIMER
This indicator is a technical analysis tool designed to estimate how far price usually moves over the next candles, from a chart's own history. It does NOT provide buy or sell signals, and it does NOT constitute financial, investment, or trading advice of any kind. Past patterns do not guarantee future market behavior. Always conduct your own analysis and consult with a qualified financial advisor before making any trading decisions. Use this tool at your own risk. The author is not responsible for any financial losses incurred from the use of this indicator.

Trend first. No fear, no FOMO: just a plan and execution.
— Rider Algo (Scripts tab on my profile)
Not financial advice.
— Rider Algo (Scripts tab on my profile)
Not financial advice.
면책사항
해당 정보와 게시물은 금융, 투자, 트레이딩 또는 기타 유형의 조언이나 권장 사항으로 간주되지 않으며, 트레이딩뷰에서 제공하거나 보증하는 것이 아닙니다. 자세한 내용은 이용 약관을 참조하세요.
Trend first. No fear, no FOMO: just a plan and execution.
— Rider Algo (Scripts tab on my profile)
Not financial advice.
— Rider Algo (Scripts tab on my profile)
Not financial advice.
면책사항
해당 정보와 게시물은 금융, 투자, 트레이딩 또는 기타 유형의 조언이나 권장 사항으로 간주되지 않으며, 트레이딩뷰에서 제공하거나 보증하는 것이 아닙니다. 자세한 내용은 이용 약관을 참조하세요.