OPEN-SOURCE SCRIPT
Hot Zone Radar [LuxAlgo]
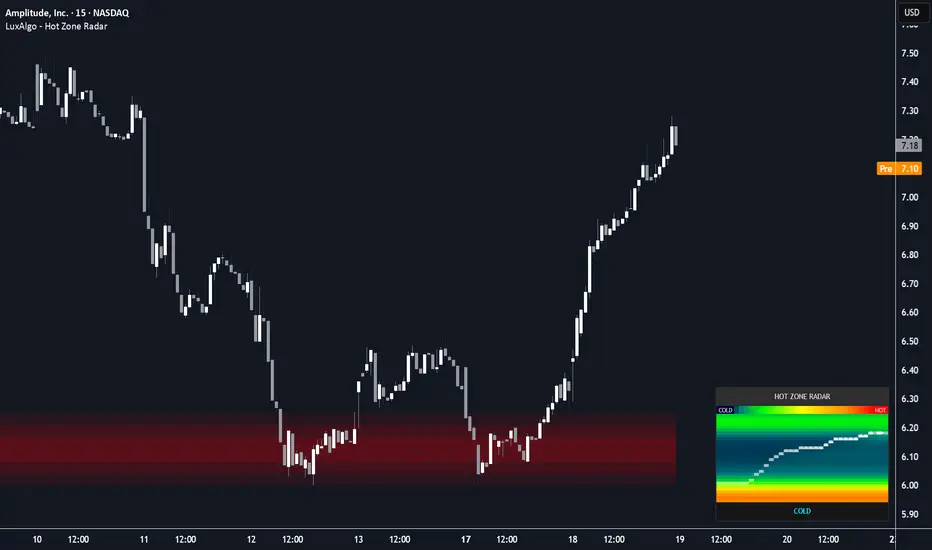
The Hot Zone Radar indicator is a sophisticated market liquidity visualization tool that combines a dynamic thermal heatmap dashboard with gradient-mapped support and resistance zones. It aims to provide traders with a real-time "weather map" of price density, identifying where the market is likely to find high-volume friction or low-volume "vacuum" gaps.
🔶 USAGE
The indicator features a dual-component interface: a high-resolution "Radar" dashboard and on-chart "Glow Zones."
The Radar Dashboard
The dashboard displays a historical matrix of volume distribution. Unlike a static volume profile, the radar shifts horizontally over time, allowing you to see how liquidity nodes have evolved.
🔹 On-Chart Gradient S/R
The script automatically identifies the most significant "Hot Zones" from the profile and projects them onto the chart as gradient-filled boxes. These zones act as dynamic support and resistance. When price enters a zone, the gradient shifts color to indicate active interaction, signaling a potential reversal or consolidation point.
🔶 DETAILS
The core logic relies on a rolling Volume Profile engine that feeds into a 2D History Matrix.
Thermal Data Engine
The script calculates volume distribution across a user-defined price range (Resolution). As new bars form, the oldest volume data is "aged out," and the matrix shifts. This creates the horizontal flow effect in the radar, showing not just where volume is, but how long it has been sitting at those levels.
Diffusion Blur
To ensure the heatmap is readable and aesthetic, a "Diffusion Blur" algorithm is applied to the matrix. This smooths out jagged volume spikes into cohesive "thermal clouds," making it easier to identify significant structural zones versus noise.
🔶 SETTINGS
🔹 Radar Logic
🔹 Support/Resistance Zones
🔹 Dashboard Styling
🔶 USAGE
The indicator features a dual-component interface: a high-resolution "Radar" dashboard and on-chart "Glow Zones."
The Radar Dashboard
The dashboard displays a historical matrix of volume distribution. Unlike a static volume profile, the radar shifts horizontally over time, allowing you to see how liquidity nodes have evolved.
- Price Trace: The current price path is plotted directly onto the heatmap using a series of markers (●) ending in a "Current" pointer (▶). This allows you to see exactly where price is relative to historical "Hot" (High Volume) and "Cold" (Low Volume) zones.
- Color Scale: The heat map transitions from Deep Blue/Cyan (Cold/Low Liquidity) to Bright Red (Hot/High Liquidity).
- Market Status: A simplified status bar at the bottom provides immediate context:
- HOT: Price is currently oscillating within a major liquidity hub.
- WARM: Price is trending toward a high-volume area.
- COLD: Price is in a low-volume "vacuum," often associated with fast breakout movements.
- STABLE: Price is moving through neutral, average volume areas.
🔹 On-Chart Gradient S/R
The script automatically identifies the most significant "Hot Zones" from the profile and projects them onto the chart as gradient-filled boxes. These zones act as dynamic support and resistance. When price enters a zone, the gradient shifts color to indicate active interaction, signaling a potential reversal or consolidation point.
🔶 DETAILS
The core logic relies on a rolling Volume Profile engine that feeds into a 2D History Matrix.
Thermal Data Engine
The script calculates volume distribution across a user-defined price range (Resolution). As new bars form, the oldest volume data is "aged out," and the matrix shifts. This creates the horizontal flow effect in the radar, showing not just where volume is, but how long it has been sitting at those levels.
Diffusion Blur
To ensure the heatmap is readable and aesthetic, a "Diffusion Blur" algorithm is applied to the matrix. This smooths out jagged volume spikes into cohesive "thermal clouds," making it easier to identify significant structural zones versus noise.
🔶 SETTINGS
🔹 Radar Logic
- Profile Lookback: The number of bars used to calculate the volume distribution.
- Resolution (Heatmap Grid): Controls the number of vertical bins and horizontal steps in the radar. Higher values provide more detail but require more processing.
- Diffusion Blur: Adjusts the smoothness of the heatmap colors.
- Intensity Gamma: Controls the sensitivity of the color gradient; lower values make "Hot" zones appear more easily.
🔹 Support/Resistance Zones
- Show Gradient S/R Zones: Toggles the on-chart liquidity boxes.
- S/R Sensitivity %: Determines the volume threshold required to trigger a zone. Higher percentages show only the most intense liquidity hubs.
- Gradient Steps: Sets the number of layered boxes used to create the "glow" effect.
🔹 Dashboard Styling
- Position: Choose between Top Right, Bottom Right, or Bottom Left.
- Overall Panel Size: Scales the entire UI (text and grid) to fit your screen resolution.
오픈 소스 스크립트
트레이딩뷰의 진정한 정신에 따라, 이 스크립트의 작성자는 이를 오픈소스로 공개하여 트레이더들이 기능을 검토하고 검증할 수 있도록 했습니다. 작성자에게 찬사를 보냅니다! 이 코드는 무료로 사용할 수 있지만, 코드를 재게시하는 경우 하우스 룰이 적용된다는 점을 기억하세요.

All content & scripts provided by LuxAlgo are for educational purposes only and are not financial advice.
면책사항
해당 정보와 게시물은 금융, 투자, 트레이딩 또는 기타 유형의 조언이나 권장 사항으로 간주되지 않으며, 트레이딩뷰에서 제공하거나 보증하는 것이 아닙니다. 자세한 내용은 이용 약관을 참조하세요.
오픈 소스 스크립트
트레이딩뷰의 진정한 정신에 따라, 이 스크립트의 작성자는 이를 오픈소스로 공개하여 트레이더들이 기능을 검토하고 검증할 수 있도록 했습니다. 작성자에게 찬사를 보냅니다! 이 코드는 무료로 사용할 수 있지만, 코드를 재게시하는 경우 하우스 룰이 적용된다는 점을 기억하세요.
면책사항
해당 정보와 게시물은 금융, 투자, 트레이딩 또는 기타 유형의 조언이나 권장 사항으로 간주되지 않으며, 트레이딩뷰에서 제공하거나 보증하는 것이 아닙니다. 자세한 내용은 이용 약관을 참조하세요.