Weekend Gap Tracker & Fill Statistics
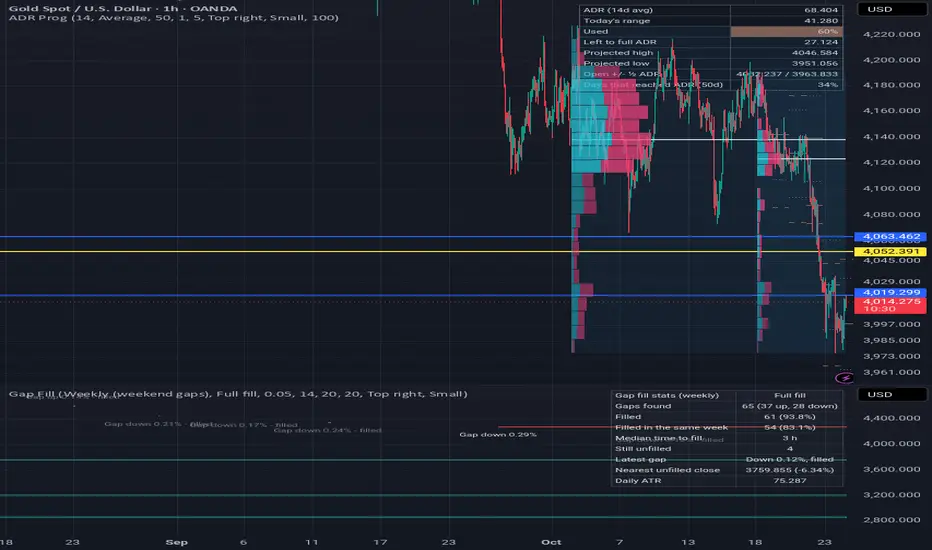
OVERVIEW
This indicator marks the gap between the last close of one week and the first open of the next, follows each gap until price trades back into it, and keeps statistics on how gaps behave on the symbol you are viewing. It can also work on daily session gaps instead of weekend gaps. It is useful on markets that close for the weekend or overnight, such as forex, gold, indices and other CFDs, and works on any timeframe up to the gap period.
WHAT MAKES IT DIFFERENT
- Each gap is tracked from the moment it opens: the box keeps extending while the gap is open and turns grey once it is filled.
- It measures partial fills, so you can see that a gap is, for example, 60% filled even before price reaches the previous close.
- A statistics table shows how many gaps were found, how many were filled, how many were filled within the same week (or day), and the median time it took to fill them.
- A minimum gap size based on the previous day's ATR filters out tiny one- or two-tick gaps that would otherwise inflate the fill rate.
HOW IT WORKS
- At the first bar of a new week (or day), the gap is the difference between that bar's open and the previous bar's close.
- A gap is counted only if it is at least one tick and at least the chosen multiple of the previous day's ATR.
- On every bar, the script checks how far price has moved back toward the previous close. For a gap up, that is how far the low has dropped below the gap's open; for a gap down, how far the high has risen above it.
- A gap counts as filled when price reaches the previous close (Full fill) or the middle of the gap (Half fill), depending on your setting.
- Time to fill is measured from the gap's first bar to the bar where it was filled.
HOW TO USE
1. Add the indicator to a chart on a timeframe at or below one week (weekly mode) or one day (daily mode). Intraday charts give the most precise fill times.
2. Unfilled gaps up are shaded green, unfilled gaps down are shaded red, and filled gaps turn grey. Labels show the size of each gap as a percentage of price.
3. Read the table to see how often gaps on this symbol have been filled, and how quickly. If most gaps fill within the same week, an open gap is less unusual than on a symbol where many stay open for a long time.
4. "Nearest unfilled close" shows the closest previous-close level of a gap that is still open, and its distance from the current price.
5. Set alerts for "New gap opened" or "Gap filled", or use "Any alert() function call" for a more detailed message.
INPUTS
Gaps
- Gap type (weekly or daily), fill rule (full or half), minimum gap size as a multiple of the daily ATR, and the daily ATR length.
Drawing
- Colors for gaps up, gaps down and filled gaps; whether to keep filled gaps on the chart and how many; how many unfilled gaps to draw; labels on or off.
Table
- Show table, position and text size.
LIMITATIONS
- Statistics only cover the bars loaded on your chart. On low timeframes that may be a few weeks of data, which gives a small sample.
- The most recent gaps have had less time to fill, so they lower the fill rate until they are either filled or old enough to judge.
- Gaps depend on your data feed's session times and prices. Symbols from different brokers can show different gaps, and 24-hour markets show very small daily gaps.
- Past fill rates describe what happened before. They do not predict whether a current gap will be filled.
- Spread is not included.
Free, open-source tool by cfdtools, built for CFD, forex, gold and index traders. Use it for analysis and education only.
This script is for educational and informational purposes only and is not financial advice. Trading CFDs and forex involves significant risk of loss.
This indicator marks the gap between the last close of one week and the first open of the next, follows each gap until price trades back into it, and keeps statistics on how gaps behave on the symbol you are viewing. It can also work on daily session gaps instead of weekend gaps. It is useful on markets that close for the weekend or overnight, such as forex, gold, indices and other CFDs, and works on any timeframe up to the gap period.
WHAT MAKES IT DIFFERENT
- Each gap is tracked from the moment it opens: the box keeps extending while the gap is open and turns grey once it is filled.
- It measures partial fills, so you can see that a gap is, for example, 60% filled even before price reaches the previous close.
- A statistics table shows how many gaps were found, how many were filled, how many were filled within the same week (or day), and the median time it took to fill them.
- A minimum gap size based on the previous day's ATR filters out tiny one- or two-tick gaps that would otherwise inflate the fill rate.
HOW IT WORKS
- At the first bar of a new week (or day), the gap is the difference between that bar's open and the previous bar's close.
- A gap is counted only if it is at least one tick and at least the chosen multiple of the previous day's ATR.
- On every bar, the script checks how far price has moved back toward the previous close. For a gap up, that is how far the low has dropped below the gap's open; for a gap down, how far the high has risen above it.
- A gap counts as filled when price reaches the previous close (Full fill) or the middle of the gap (Half fill), depending on your setting.
- Time to fill is measured from the gap's first bar to the bar where it was filled.
HOW TO USE
1. Add the indicator to a chart on a timeframe at or below one week (weekly mode) or one day (daily mode). Intraday charts give the most precise fill times.
2. Unfilled gaps up are shaded green, unfilled gaps down are shaded red, and filled gaps turn grey. Labels show the size of each gap as a percentage of price.
3. Read the table to see how often gaps on this symbol have been filled, and how quickly. If most gaps fill within the same week, an open gap is less unusual than on a symbol where many stay open for a long time.
4. "Nearest unfilled close" shows the closest previous-close level of a gap that is still open, and its distance from the current price.
5. Set alerts for "New gap opened" or "Gap filled", or use "Any alert() function call" for a more detailed message.
INPUTS
Gaps
- Gap type (weekly or daily), fill rule (full or half), minimum gap size as a multiple of the daily ATR, and the daily ATR length.
Drawing
- Colors for gaps up, gaps down and filled gaps; whether to keep filled gaps on the chart and how many; how many unfilled gaps to draw; labels on or off.
Table
- Show table, position and text size.
LIMITATIONS
- Statistics only cover the bars loaded on your chart. On low timeframes that may be a few weeks of data, which gives a small sample.
- The most recent gaps have had less time to fill, so they lower the fill rate until they are either filled or old enough to judge.
- Gaps depend on your data feed's session times and prices. Symbols from different brokers can show different gaps, and 24-hour markets show very small daily gaps.
- Past fill rates describe what happened before. They do not predict whether a current gap will be filled.
- Spread is not included.
Free, open-source tool by cfdtools, built for CFD, forex, gold and index traders. Use it for analysis and education only.
This script is for educational and informational purposes only and is not financial advice. Trading CFDs and forex involves significant risk of loss.

면책사항
해당 정보와 게시물은 금융, 투자, 트레이딩 또는 기타 유형의 조언이나 권장 사항으로 간주되지 않으며, 트레이딩뷰에서 제공하거나 보증하는 것이 아닙니다. 자세한 내용은 이용 약관을 참조하세요.
면책사항
해당 정보와 게시물은 금융, 투자, 트레이딩 또는 기타 유형의 조언이나 권장 사항으로 간주되지 않으며, 트레이딩뷰에서 제공하거나 보증하는 것이 아닙니다. 자세한 내용은 이용 약관을 참조하세요.