OPEN-SOURCE SCRIPT
0000 Intraday & Overnight Gap Rotation v17.00
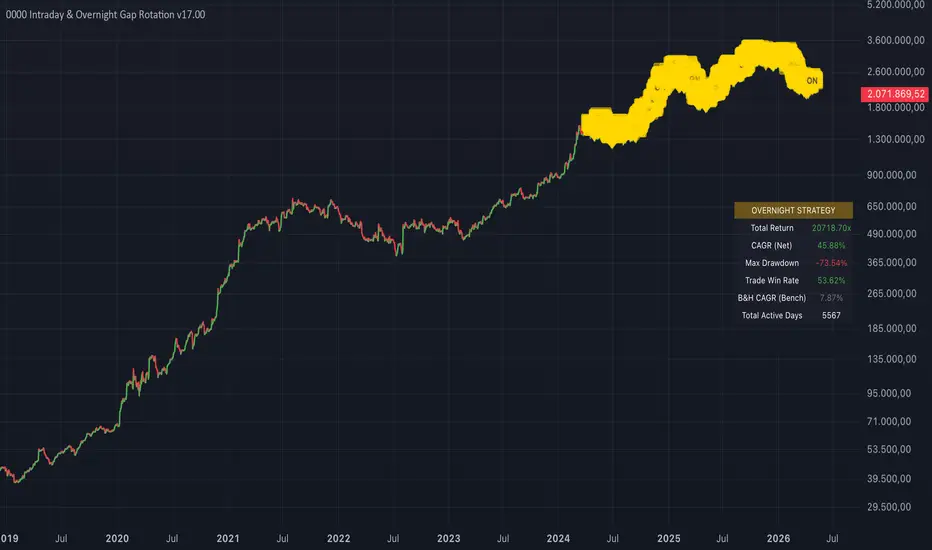
Here is a comprehensive breakdown of how the "Intraday & Overnight Gap Rotation Matrix" system works.
This strategy is designed as a quantitative testing lab to exploit (or fade) gap anomalies and intraday momentum across a basket of up to 38 assets. It does not hold positions over multiple days; instead, it executes high-frequency, strictly time-bound trades.
The Core Concept
The system revolves around the idea that market performance is heavily divided between two distinct sessions: the Overnight Session (Close to Open) and the Regular Trading Hours (Open to Close). Depending on the mode you select, the algorithm tries to capture specific behavioral anomalies within these windows.
The 3 Strategy Modes
1. Overnight Premium (Buy Close, Sell Open)
The Logic: Historically, a massive portion of the stock market's total return occurs while the market is closed. This mode attempts to capture that "night effect."
The Trigger: Just before the market closes today, the system looks at the intraday performance (Open to Close) of all assets.
The Action: It buys the top-performing assets right at the Close, holds them overnight, and sells them immediately at the next morning's Open, capturing the overnight gap.
2. Intraday Momentum (Buy Open, Sell Close - Best Gaps)
The Logic: "Strength begets strength." If an asset gaps up strongly at the open due to overnight news or earnings, momentum traders will often push it even higher during the day.
The Trigger: At the Open, the system measures the overnight gap (Yesterday's Close to Today's Open).
The Action: It buys the assets with the highest positive gaps right at the Open and sells them at the Close of the same day.
3. Intraday Fade (Buy Open, Sell Close - Worst Gaps)
The Logic: Mean reversion. When an asset suffers a violent, panicked gap down at the open, it has often overreacted. Institutional buyers frequently step in to "buy the dip," causing the gap to partially close intraday.
The Trigger: At the Open, the system measures the overnight gap, but ranks them in reverse.
The Action: It buys the assets with the most brutal negative gaps at the Open and sells them at the Close, hoping for an intraday bounce.
Key Mechanics & Filters
The Universe & Top N Rotation: The system tracks a customized universe of up to 38 assets. Every single day, it ranks them all according to the chosen strategy mode and allocates capital equally into the "Top N" (e.g., the top 5).
The Minimum Move Threshold: This is the most crucial filter for real-world application. High-frequency systems are easily destroyed by trading costs (slippage, bid/ask spread, commissions). The threshold ensures the system only trades when the setup is extreme enough to justify the costs. If no asset meets the minimum threshold (e.g., > 1.5% move), the system stays safely in cash for the day.
Cost Simulation: The system applies a customizable cost penalty twice per day (once for the entry, once for the exit) to simulate a highly realistic equity curve.
Seasonality Matrix (Optional): A master switch that can block all trading during specific, historically weak calendar quarters or half-months, forcing the portfolio into cash to avoid systemic market drawdowns.
The Analytics Dashboard
Instead of just plotting buy and sell arrows, the system acts as a live analytics engine. It features a dashboard that tracks:
Net CAGR: Compound Annual Growth Rate, after all simulated trading costs.
Maximum Drawdown: The worst peak-to-trough drop the strategy ever experienced.
Trade Win Rate: The percentage of daily rotations that ended in a profit.
Daily Popups: Chart labels that break down exactly which assets were bought, what their target metric was (the Gap or the ID Run), and what their exact Profit/Loss contribution was for that specific session.
This strategy is designed as a quantitative testing lab to exploit (or fade) gap anomalies and intraday momentum across a basket of up to 38 assets. It does not hold positions over multiple days; instead, it executes high-frequency, strictly time-bound trades.
The Core Concept
The system revolves around the idea that market performance is heavily divided between two distinct sessions: the Overnight Session (Close to Open) and the Regular Trading Hours (Open to Close). Depending on the mode you select, the algorithm tries to capture specific behavioral anomalies within these windows.
The 3 Strategy Modes
1. Overnight Premium (Buy Close, Sell Open)
The Logic: Historically, a massive portion of the stock market's total return occurs while the market is closed. This mode attempts to capture that "night effect."
The Trigger: Just before the market closes today, the system looks at the intraday performance (Open to Close) of all assets.
The Action: It buys the top-performing assets right at the Close, holds them overnight, and sells them immediately at the next morning's Open, capturing the overnight gap.
2. Intraday Momentum (Buy Open, Sell Close - Best Gaps)
The Logic: "Strength begets strength." If an asset gaps up strongly at the open due to overnight news or earnings, momentum traders will often push it even higher during the day.
The Trigger: At the Open, the system measures the overnight gap (Yesterday's Close to Today's Open).
The Action: It buys the assets with the highest positive gaps right at the Open and sells them at the Close of the same day.
3. Intraday Fade (Buy Open, Sell Close - Worst Gaps)
The Logic: Mean reversion. When an asset suffers a violent, panicked gap down at the open, it has often overreacted. Institutional buyers frequently step in to "buy the dip," causing the gap to partially close intraday.
The Trigger: At the Open, the system measures the overnight gap, but ranks them in reverse.
The Action: It buys the assets with the most brutal negative gaps at the Open and sells them at the Close, hoping for an intraday bounce.
Key Mechanics & Filters
The Universe & Top N Rotation: The system tracks a customized universe of up to 38 assets. Every single day, it ranks them all according to the chosen strategy mode and allocates capital equally into the "Top N" (e.g., the top 5).
The Minimum Move Threshold: This is the most crucial filter for real-world application. High-frequency systems are easily destroyed by trading costs (slippage, bid/ask spread, commissions). The threshold ensures the system only trades when the setup is extreme enough to justify the costs. If no asset meets the minimum threshold (e.g., > 1.5% move), the system stays safely in cash for the day.
Cost Simulation: The system applies a customizable cost penalty twice per day (once for the entry, once for the exit) to simulate a highly realistic equity curve.
Seasonality Matrix (Optional): A master switch that can block all trading during specific, historically weak calendar quarters or half-months, forcing the portfolio into cash to avoid systemic market drawdowns.
The Analytics Dashboard
Instead of just plotting buy and sell arrows, the system acts as a live analytics engine. It features a dashboard that tracks:
Net CAGR: Compound Annual Growth Rate, after all simulated trading costs.
Maximum Drawdown: The worst peak-to-trough drop the strategy ever experienced.
Trade Win Rate: The percentage of daily rotations that ended in a profit.
Daily Popups: Chart labels that break down exactly which assets were bought, what their target metric was (the Gap or the ID Run), and what their exact Profit/Loss contribution was for that specific session.
오픈 소스 스크립트
트레이딩뷰의 진정한 정신에 따라, 이 스크립트의 작성자는 이를 오픈소스로 공개하여 트레이더들이 기능을 검토하고 검증할 수 있도록 했습니다. 작성자에게 찬사를 보냅니다! 이 코드는 무료로 사용할 수 있지만, 코드를 재게시하는 경우 하우스 룰이 적용된다는 점을 기억하세요.

면책사항
해당 정보와 게시물은 금융, 투자, 트레이딩 또는 기타 유형의 조언이나 권장 사항으로 간주되지 않으며, 트레이딩뷰에서 제공하거나 보증하는 것이 아닙니다. 자세한 내용은 이용 약관을 참조하세요.
오픈 소스 스크립트
트레이딩뷰의 진정한 정신에 따라, 이 스크립트의 작성자는 이를 오픈소스로 공개하여 트레이더들이 기능을 검토하고 검증할 수 있도록 했습니다. 작성자에게 찬사를 보냅니다! 이 코드는 무료로 사용할 수 있지만, 코드를 재게시하는 경우 하우스 룰이 적용된다는 점을 기억하세요.
면책사항
해당 정보와 게시물은 금융, 투자, 트레이딩 또는 기타 유형의 조언이나 권장 사항으로 간주되지 않으며, 트레이딩뷰에서 제공하거나 보증하는 것이 아닙니다. 자세한 내용은 이용 약관을 참조하세요.