OPEN-SOURCE SCRIPT
업데이트됨 MADZ - Moving Average Deviation Z-Score
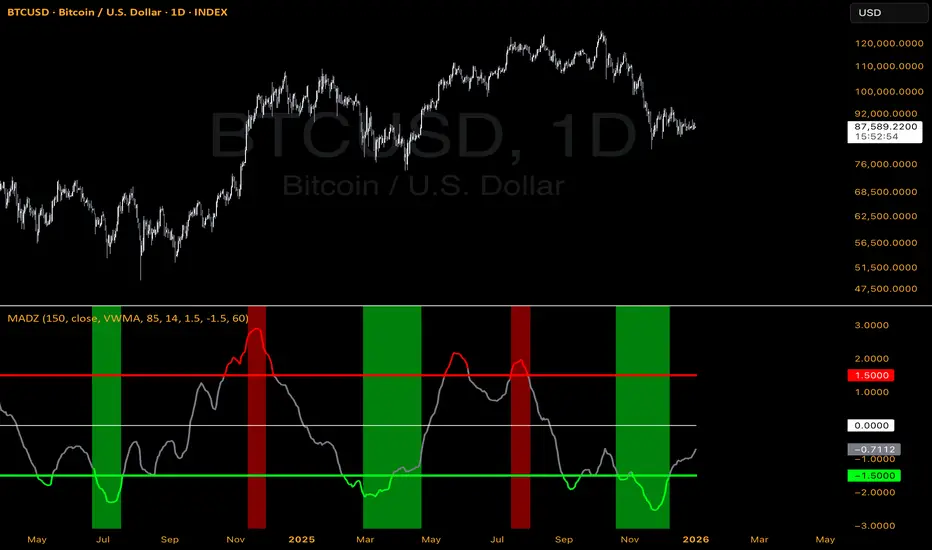
MADZ - Moving Average Deviation Z-Score
MADZ is a powerful valuation oscillator that measures how far the current price has deviated from a user-selected moving average, expressed in statistical terms as a Z-Score. This normalization makes it easier to identify overvalued and undervalued conditions across different assets, timeframes, and market environments.
Overview
The indicator works by:
Calculating the percentage deviation of price from a customizable moving average (SMA, EMA, WMA, VWMA, HMA, or RMA).
Applying a Z-Score transformation to this deviation over a chosen lookback period — showing how many standard deviations the current deviation is from its historical average. Smoothing the result for a clean, responsive oscillator centered around zero.
Positive values indicate price is trading above the moving average (potentially overvalued), while negative values suggest price is below (potentially undervalued). The further from zero, the greater the relative valuation extreme.
Key Features
Extreme Zone Highlighting Explained
The highlighted extreme zones (background shading) are not based on the fixed static levels. Instead, they signal statistically significant outliers using dynamic bands:
Overbought extreme zone (red background): Triggered when MADZ rises above the upper dynamic band (+3 standard deviations of the MADZ line itself over the dynamic length period).
Oversold extreme zone (green background): Triggered when MADZ falls below the lower dynamic band (-3 standard deviations).
These ±3σ bands adapt to the recent behavior of the oscillator. Because they represent three standard deviations from the mean of MADZ, crossings are rare and often precede major reversals or trend accelerations — making them valuable for spotting potential turning points in valuation extremes.
How to Use
Settings
This is an educational tool designed to aid in valuation analysis. The information provided is not financial advice. Always conduct your own research and consider multiple factors before making trading decisions. Trade at your own risk.
MADZ is a powerful valuation oscillator that measures how far the current price has deviated from a user-selected moving average, expressed in statistical terms as a Z-Score. This normalization makes it easier to identify overvalued and undervalued conditions across different assets, timeframes, and market environments.
Overview
The indicator works by:
Calculating the percentage deviation of price from a customizable moving average (SMA, EMA, WMA, VWMA, HMA, or RMA).
Applying a Z-Score transformation to this deviation over a chosen lookback period — showing how many standard deviations the current deviation is from its historical average. Smoothing the result for a clean, responsive oscillator centered around zero.
Positive values indicate price is trading above the moving average (potentially overvalued), while negative values suggest price is below (potentially undervalued). The further from zero, the greater the relative valuation extreme.
Key Features
- Customizable base moving average (type and length)
- Z-Score normalization for statistically meaningful readings
- Final smoothing for reduced noise
- Static overbought/oversold levels (default ±1.5) — line changes color when crossed (red above, green below)
- Dynamic extreme bands (±3σ) — optional display of bands calculated from the oscillator’s own volatility over a user-defined period
- Extreme zone highlighting — background shading activates only during truly rare valuation events
Extreme Zone Highlighting Explained
The highlighted extreme zones (background shading) are not based on the fixed static levels. Instead, they signal statistically significant outliers using dynamic bands:
Overbought extreme zone (red background): Triggered when MADZ rises above the upper dynamic band (+3 standard deviations of the MADZ line itself over the dynamic length period).
Oversold extreme zone (green background): Triggered when MADZ falls below the lower dynamic band (-3 standard deviations).
These ±3σ bands adapt to the recent behavior of the oscillator. Because they represent three standard deviations from the mean of MADZ, crossings are rare and often precede major reversals or trend accelerations — making them valuable for spotting potential turning points in valuation extremes.
How to Use
- Use zero-line crosses for trend changes or mean-reversion setups.
- Watch static level crossings (±1.5 default) for early overbought/oversold warnings.
- Pay special attention to extreme zone shading — these highlight high-conviction valuation dislocations that may offer superior risk/reward opportunities.
- Designed on the BTC chart, but can be used on other assets.
Settings
- Moving Average Settings: Type, length, source
- Z-Score & Smoothing: Lookback period and smoothing length
- Threshold Levels: Static overbought/oversold thresholds
- Display Options: Toggle dynamic bands and extreme background highlighting
This is an educational tool designed to aid in valuation analysis. The information provided is not financial advice. Always conduct your own research and consider multiple factors before making trading decisions. Trade at your own risk.
릴리즈 노트
Removed unnecessary code.오픈 소스 스크립트
트레이딩뷰의 진정한 정신에 따라, 이 스크립트의 작성자는 이를 오픈소스로 공개하여 트레이더들이 기능을 검토하고 검증할 수 있도록 했습니다. 작성자에게 찬사를 보냅니다! 이 코드는 무료로 사용할 수 있지만, 코드를 재게시하는 경우 하우스 룰이 적용된다는 점을 기억하세요.

면책사항
해당 정보와 게시물은 금융, 투자, 트레이딩 또는 기타 유형의 조언이나 권장 사항으로 간주되지 않으며, 트레이딩뷰에서 제공하거나 보증하는 것이 아닙니다. 자세한 내용은 이용 약관을 참조하세요.
오픈 소스 스크립트
트레이딩뷰의 진정한 정신에 따라, 이 스크립트의 작성자는 이를 오픈소스로 공개하여 트레이더들이 기능을 검토하고 검증할 수 있도록 했습니다. 작성자에게 찬사를 보냅니다! 이 코드는 무료로 사용할 수 있지만, 코드를 재게시하는 경우 하우스 룰이 적용된다는 점을 기억하세요.
면책사항
해당 정보와 게시물은 금융, 투자, 트레이딩 또는 기타 유형의 조언이나 권장 사항으로 간주되지 않으며, 트레이딩뷰에서 제공하거나 보증하는 것이 아닙니다. 자세한 내용은 이용 약관을 참조하세요.