OPEN-SOURCE SCRIPT
Adaptive VIDYA Trend [SchizoQuant]
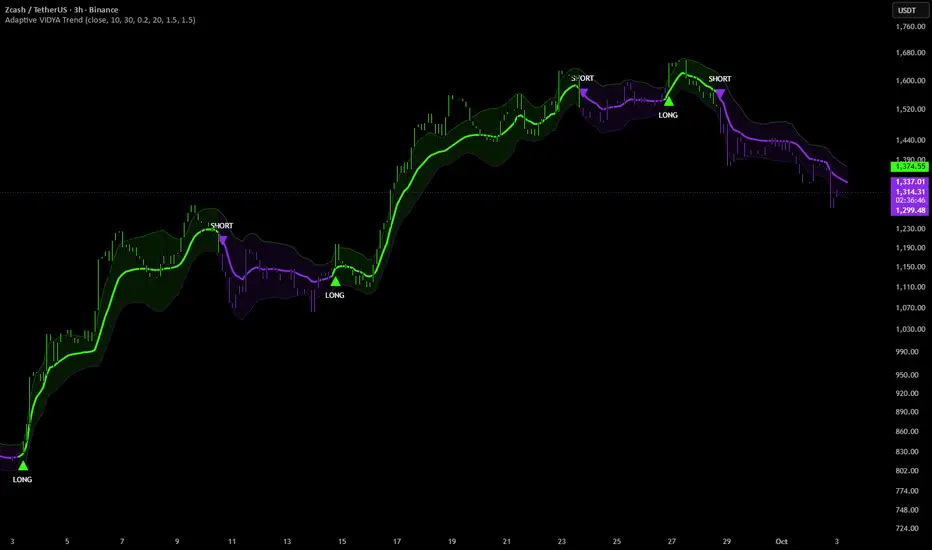
🟣Adaptive VIDYA Trend is an adaptive trend-regime indicator that uses a volatility-responsive moving average together with residual-volatility bands to identify persistent bullish and bearish market states.
Instead of using a fixed smoothing rate, the indicator adjusts the responsiveness of VIDYA according to the relationship between short-term and long-term volatility.
When short-term volatility becomes stronger relative to the longer-term reference, VIDYA can respond more quickly to movement in the selected source.
When short-term volatility is weaker relative to the longer-term reference, the smoothing rate decreases and VIDYA reacts more gradually.
Adaptive bands built from the statistical dispersion of the selected source around VIDYA are then used to determine when the active trend regime changes.
🟣✦ How It Works
🟣✦ Volatility Ratio
🟣✦ Adaptive VIDYA Smoothing
🟣✦ Price Residual
🟣✦ Residual Volatility Bands
🟣✦ Trend Regime
🟣✦ Regime Transitions
🟣✦ Visual Feedback
🟣✦ Data Window Metrics
🟣✦ User Controls
🟣✦ Intended Use
🟣✦ Limitations
Instead of using a fixed smoothing rate, the indicator adjusts the responsiveness of VIDYA according to the relationship between short-term and long-term volatility.
When short-term volatility becomes stronger relative to the longer-term reference, VIDYA can respond more quickly to movement in the selected source.
When short-term volatility is weaker relative to the longer-term reference, the smoothing rate decreases and VIDYA reacts more gradually.
Adaptive bands built from the statistical dispersion of the selected source around VIDYA are then used to determine when the active trend regime changes.
🟣✦ How It Works
The calculation follows this structure:
Short-Term Source Volatility
↓
Long-Term Source Volatility
↓
Volatility Ratio
↓
Adaptive VIDYA Smoothing
↓
Source-to-VIDYA Residual
↓
Residual Deviation
↓
Adaptive Upper / Lower Bands
↓
Persistent Bullish / Bearish Regime
The indicator first compares short-term and long-term standard deviation.
This relationship determines how aggressively VIDYA responds to the selected source.
The resulting VIDYA is then used as the central reference for measuring source displacement and constructing the adaptive trend bands.
🟣✦ Volatility Ratio
The adaptive behavior begins with two volatility measurements.
Short Deviation Length → Measures recent short-term dispersion.
Long Deviation Length → Provides the broader volatility reference.
The script calculates both standard deviations and divides the short-term value by the long-term value:Pine Script®
This produces the VIDYA Volatility Ratio.
A higher ratio indicates that recent volatility is elevated relative to the longer-term environment.
A lower ratio indicates that recent volatility is subdued relative to the longer-term reference.
🟣✦ Adaptive VIDYA Smoothing
The volatility ratio is multiplied by the selected Base Smoothing value.
The resulting adaptive smoothing factor is then constrained between 0 and 1:Pine Script®
That value determines how much weight the recursive VIDYA calculation gives to the current source relative to its previous value:Pine Script®
Higher adaptive smoothing places more weight on the current source value.
Lower adaptive smoothing places more weight on the previous VIDYA value.
This allows the centerline to change its responsiveness as the relationship between short-term and long-term volatility changes.
🟣✦ Price Residual
After calculating VIDYA, the indicator measures the difference between the selected source and the adaptive centerline:Pine Script®
This value is called the residual.
Positive residual values indicate that the selected source is above VIDYA.
Negative residual values indicate that the selected source is below VIDYA.
The magnitude and variability of these residuals provide a direct measurement of how widely the selected source has recently been moving around the adaptive trend baseline.
🟣✦ Residual Volatility Bands
The standard deviation of the residual is calculated over the selected Band Length:Pine Script®
That residual deviation is multiplied independently by the Upper Band Multiplier and Lower Band Multiplier to construct the two adaptive boundaries around VIDYA:Pine Script®
Upper Band → VIDYA + Residual Deviation × Upper Band Multiplier
Lower Band → VIDYA − Residual Deviation × Lower Band Multiplier
Because the bands are based on the dispersion of the selected source around VIDYA, their distance naturally changes as residual volatility expands or contracts.
Higher residual volatility produces wider bands.
Lower residual volatility produces narrower bands.
The two independent multipliers also allow bullish and bearish regime-change thresholds to be configured asymmetrically.
🟣✦ Trend Regime
The indicator maintains a persistent bullish or bearish trend regime.
The raw directional conditions are defined by the selected source moving outside the adaptive bands:Pine Script®
The internal regime is initialized from the relationship between the selected source and VIDYA:Pine Script®
A move above the upper band changes the regime to bullish.
A move below the lower band changes the regime to bearish.Pine Script®
When the selected source remains between the two bands, neither condition is triggered and the previous regime is preserved.
This creates a persistent state rather than repeatedly switching direction whenever the selected source moves around the VIDYA centerline.
🟣✦ Regime Transitions
LONG and SHORT markers identify changes in the internal trend regime rather than every bar that remains bullish or bearish.
The transition logic is:Pine Script®
LONG → The internal regime has changed into the bullish state.
SHORT → The internal regime has changed into the bearish state.
Once a regime is established, another signal is not generated until the opposite band condition causes the internal state to reverse.
This separates regime-change events from the persistent bullish or bearish state that follows them.
🟣✦ Visual Feedback
The active regime determines the primary chart color:Pine Script®
Neon Green → Bullish regime
Purple → Bearish regime
The Adaptive VIDYA centerline uses the active regime color.
Optional upper and lower adaptive bands show the current residual-volatility boundaries around VIDYA.
An optional fill between the bands provides additional visual emphasis for the active regime.
LONG and SHORT markers identify regime transitions.
Optional candle coloring makes the current bullish or bearish state immediately visible on the price chart.
🟣✦ Data Window Metrics
Several internal values are exposed through the TradingView Data Window:
VIDYA Volatility Ratio
VIDYA Adaptive Smoothing
Price VIDYA Residual
Residual Deviation
The script makes these values available without plotting them directly on the visible chart:Pine Script®
These measurements provide additional visibility into how the moving average and adaptive bands are responding to current market conditions.
🟣✦ User Controls
Source → Selects the price series used throughout the adaptive calculation and regime logic.
Short Deviation Length → Controls the short-term volatility measurement used in the VIDYA ratio.
Long Deviation Length → Controls the longer-term volatility reference used in the VIDYA ratio.
Base Smoothing → Controls the base responsiveness of VIDYA before volatility adaptation is applied.
Band Length → Controls how much residual history is used to estimate dispersion around VIDYA.
Upper Band Multiplier → Controls the residual-deviation distance above VIDYA. Higher values require greater upward displacement before the regime can change bullish.
Lower Band Multiplier → Controls the residual-deviation distance below VIDYA. Higher values require greater downward displacement before the regime can change bearish.
Visualization settings allow the bands, band fill, regime-change signals, and candle coloring to be independently displayed or hidden without changing the underlying calculations.
🟣✦ Intended Use
Adaptive VIDYA Trend is designed for identifying persistent directional regimes while adapting both its trend baseline and reversal boundaries to changing market behavior.
It can be used as:
A standalone trend-state indicator
A directional trend filter
An adaptive moving-average framework
A confirmation layer for systematic strategies
A regime filter for identifying sustained bullish or bearish conditions
A visual framework for evaluating source displacement relative to an adaptive trend baseline
🟣✦ Limitations
Adaptive VIDYA Trend is a trend-regime indicator and not a complete trading system. LONG and SHORT markers identify changes in the indicator's internal regime and do not imply guaranteed trading outcomes or future performance.
The responsiveness of VIDYA depends on the relationship between short-term and long-term volatility, so rapid changes in volatility can materially alter the smoothing rate.
The adaptive bands depend on the historical dispersion of the selected source around VIDYA. Wider residual volatility can delay regime changes, while narrower residual volatility can make the regime more sensitive to source displacement.
The Upper Band Multiplier and Lower Band Multiplier independently affect bullish and bearish reversal sensitivity. Higher values require larger displacement on the corresponding side of VIDYA before the regime changes, while lower values create tighter thresholds. Using different upper and lower values creates asymmetric regime sensitivity.
The selected source, volatility lengths, smoothing factor, and residual-band settings can materially change the behavior of the indicator.
The script does not use higher-timeframe requests or lookahead logic.
오픈 소스 스크립트
트레이딩뷰의 진정한 정신에 따라, 이 스크립트의 작성자는 이를 오픈소스로 공개하여 트레이더들이 기능을 검토하고 검증할 수 있도록 했습니다. 작성자에게 찬사를 보냅니다! 이 코드는 무료로 사용할 수 있지만, 코드를 재게시하는 경우 하우스 룰이 적용된다는 점을 기억하세요.

🟣Crypto market intelligence + Premium indicators & strategies Free trial at schizoquant.com
면책사항
해당 정보와 게시물은 금융, 투자, 트레이딩 또는 기타 유형의 조언이나 권장 사항으로 간주되지 않으며, 트레이딩뷰에서 제공하거나 보증하는 것이 아닙니다. 자세한 내용은 이용 약관을 참조하세요.
오픈 소스 스크립트
트레이딩뷰의 진정한 정신에 따라, 이 스크립트의 작성자는 이를 오픈소스로 공개하여 트레이더들이 기능을 검토하고 검증할 수 있도록 했습니다. 작성자에게 찬사를 보냅니다! 이 코드는 무료로 사용할 수 있지만, 코드를 재게시하는 경우 하우스 룰이 적용된다는 점을 기억하세요.
🟣Crypto market intelligence + Premium indicators & strategies Free trial at schizoquant.com
면책사항
해당 정보와 게시물은 금융, 투자, 트레이딩 또는 기타 유형의 조언이나 권장 사항으로 간주되지 않으며, 트레이딩뷰에서 제공하거나 보증하는 것이 아닙니다. 자세한 내용은 이용 약관을 참조하세요.