4 Candle Pattern [odnac]
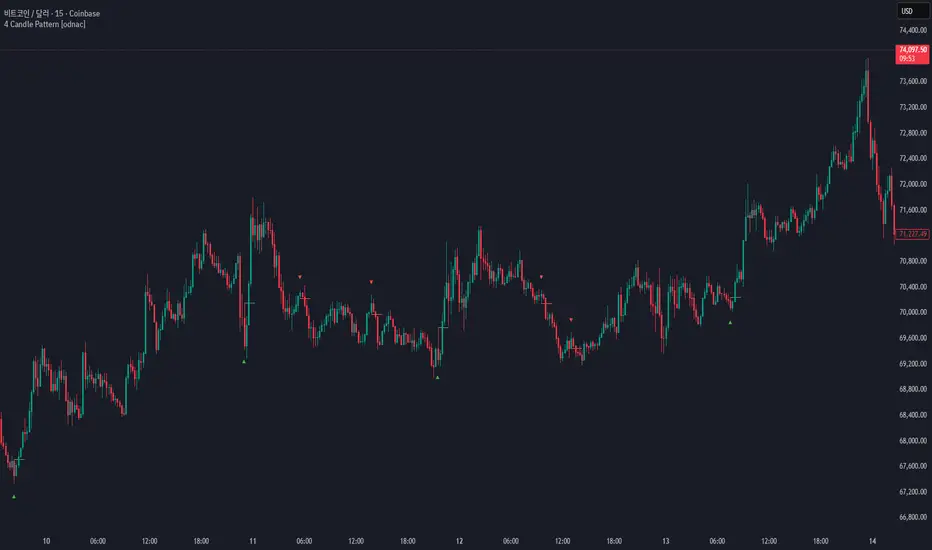
Long Signal (▲)
Short Signal (▼)
Settings
- Candle 1: Bearish
- Candles 2, 3, 4: Bullish
- A price gap exists between Candle 2 high and Candle 4 low
- Candle 1's high falls within that gap
Short Signal (▼)
- Candle 1: Bullish
- Candles 2, 3, 4: Bearish
- A price gap exists between Candle 2 low and Candle 4 high
- Candle 1's low falls within that gap
Once a pattern is detected, a line is drawn from Candle 1's low (short) or high (long).
⚠️ Note: The signal marker (▼/▲) is plotted on Candle 1, which is 3 bars in the past at the time of detection.
Since the signal appears only after all 4 candles are completed, wait for price to retrace back to the line before entering.
Settings
- Show Signals: Toggle the ▼/▲ markers
- Show Lines: Toggle the entry level lines
- Short / Long Color: Customize signal colors

면책사항
해당 정보와 게시물은 금융, 투자, 트레이딩 또는 기타 유형의 조언이나 권장 사항으로 간주되지 않으며, 트레이딩뷰에서 제공하거나 보증하는 것이 아닙니다. 자세한 내용은 이용 약관을 참조하세요.
면책사항
해당 정보와 게시물은 금융, 투자, 트레이딩 또는 기타 유형의 조언이나 권장 사항으로 간주되지 않으며, 트레이딩뷰에서 제공하거나 보증하는 것이 아닙니다. 자세한 내용은 이용 약관을 참조하세요.