OPEN-SOURCE SCRIPT
ICT Premium Discount
OVERVIEW
ICT Premium Discount splits the current swing range into two halves around its midpoint. The half above the midpoint is premium and the half below it is discount. It also draws the optimal trade entry zone, a retracement band between two chosen levels, and a set of Fibonacci levels across the range. A small table shows where the latest close sits.
HOW IT WORKS
The indicator finds swings and tracks the market bias from breaks of structure and changes of character. The range follows the bias. In a bullish bias, the range top is refreshed by each new swing high, and the range bottom moves only when a lower low appears. In a bearish bias, it is the mirror. Without a bias, both ends follow the latest swing. The midpoint of the range is the equilibrium. Price above it is in premium and price below it is in discount. The optimal trade entry zone is a band between two retracement levels, with a sweet spot line between them. Fibonacci level lines are drawn across the range. Two alerts fire while price is inside the zone.
https://KaLkQcOc
The swing range split at its midpoint, with the OTE band and the Fibonacci levels, on a 4h Bitcoin chart.
WHAT YOU'LL SEE ON THE CHART
https://pRSR9Q19
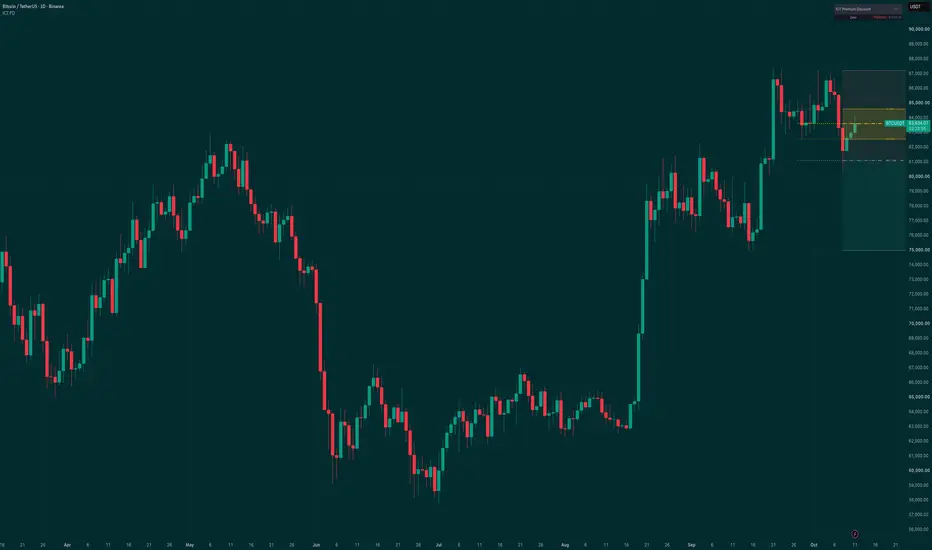
The same indicator on a daily Bitcoin chart, where the range is measured from larger swings.
BEST FOR
This indicator draws and labels price structure rather than reporting a single event type, so no market or timeframe group is singled out. It was not measured, and it reads the candles of whatever chart it is placed on.
ALERTS
LIMITATIONS
The script reads the candles of the chart it is placed on, so results on non-standard chart types differ from results on regular candles. Swing points are known only after the chosen number of bars has passed, so swing-based items appear with that delay. It is a drawing and labelling tool, not a forecast. It is weaker in these situations:
OPEN SOURCE
The source code is open. This script is one module of the author's own larger ICT toolkit, published here on its own so it can be read, checked and reused under the Mozilla Public License 2.0.
ACCESS
Free, open-source script.
DISCLAIMER
This indicator is a technical analysis tool, not investment advice. The author is not a registered investment adviser, broker or dealer. Nothing here is a recommendation to buy, sell or hold any instrument. What you see on the chart is the output of a calculation you configured. Any decision you take from it is yours. Past behaviour of an indicator — including anything you observe in historical bars or in a backtest, which is a simulation — does not indicate future results. Trading carries a real risk of loss, including your entire capital. Charting uses TradingView® technology. TradingView is unaffiliated with the author. For educational purposes only. Not investment advice.
ICT Premium Discount splits the current swing range into two halves around its midpoint. The half above the midpoint is premium and the half below it is discount. It also draws the optimal trade entry zone, a retracement band between two chosen levels, and a set of Fibonacci levels across the range. A small table shows where the latest close sits.
HOW IT WORKS
The indicator finds swings and tracks the market bias from breaks of structure and changes of character. The range follows the bias. In a bullish bias, the range top is refreshed by each new swing high, and the range bottom moves only when a lower low appears. In a bearish bias, it is the mirror. Without a bias, both ends follow the latest swing. The midpoint of the range is the equilibrium. Price above it is in premium and price below it is in discount. The optimal trade entry zone is a band between two retracement levels, with a sweet spot line between them. Fibonacci level lines are drawn across the range. Two alerts fire while price is inside the zone.
https://KaLkQcOc
The swing range split at its midpoint, with the OTE band and the Fibonacci levels, on a 4h Bitcoin chart.
WHAT YOU'LL SEE ON THE CHART
- Premium and discount zones — two shaded halves of the range around an equilibrium line, the discount half in the bullish colour and the premium half in the bearish colour.
- OTE zone — a shaded band in the accent colour between the two retracement levels, with a line at the sweet spot.
- Fibonacci levels — horizontal lines across the range, those inside the OTE band emphasised.
- Dashboard — a small table with the zone price is in and its position in the range.
https://pRSR9Q19
The same indicator on a daily Bitcoin chart, where the range is measured from larger swings.
BEST FOR
This indicator draws and labels price structure rather than reporting a single event type, so no market or timeframe group is singled out. It was not measured, and it reads the candles of whatever chart it is placed on.
ALERTS
- Price In Bullish OTE
- Price In Bearish OTE
LIMITATIONS
The script reads the candles of the chart it is placed on, so results on non-standard chart types differ from results on regular candles. Swing points are known only after the chosen number of bars has passed, so swing-based items appear with that delay. It is a drawing and labelling tool, not a forecast. It is weaker in these situations:
- Choppy markets, where the range changes often
- Early in a chart, before swings and bias are established
- Reading the Fibonacci lines and the OTE band together in a bullish range, since they are measured from different ends
- Intrabar use, since a zone alert can disappear before the bar closes
OPEN SOURCE
The source code is open. This script is one module of the author's own larger ICT toolkit, published here on its own so it can be read, checked and reused under the Mozilla Public License 2.0.
ACCESS
Free, open-source script.
DISCLAIMER
This indicator is a technical analysis tool, not investment advice. The author is not a registered investment adviser, broker or dealer. Nothing here is a recommendation to buy, sell or hold any instrument. What you see on the chart is the output of a calculation you configured. Any decision you take from it is yours. Past behaviour of an indicator — including anything you observe in historical bars or in a backtest, which is a simulation — does not indicate future results. Trading carries a real risk of loss, including your entire capital. Charting uses TradingView® technology. TradingView is unaffiliated with the author. For educational purposes only. Not investment advice.
오픈 소스 스크립트
트레이딩뷰의 진정한 정신에 따라, 이 스크립트의 작성자는 이를 오픈소스로 공개하여 트레이더들이 기능을 검토하고 검증할 수 있도록 했습니다. 작성자에게 찬사를 보냅니다! 이 코드는 무료로 사용할 수 있지만, 코드를 재게시하는 경우 하우스 룰이 적용된다는 점을 기억하세요.

volebot — technical-analysis indicators with plain-language docs. Access requests and contact: vole.bot
면책사항
해당 정보와 게시물은 금융, 투자, 트레이딩 또는 기타 유형의 조언이나 권장 사항으로 간주되지 않으며, 트레이딩뷰에서 제공하거나 보증하는 것이 아닙니다. 자세한 내용은 이용 약관을 참조하세요.
오픈 소스 스크립트
트레이딩뷰의 진정한 정신에 따라, 이 스크립트의 작성자는 이를 오픈소스로 공개하여 트레이더들이 기능을 검토하고 검증할 수 있도록 했습니다. 작성자에게 찬사를 보냅니다! 이 코드는 무료로 사용할 수 있지만, 코드를 재게시하는 경우 하우스 룰이 적용된다는 점을 기억하세요.
면책사항
해당 정보와 게시물은 금융, 투자, 트레이딩 또는 기타 유형의 조언이나 권장 사항으로 간주되지 않으며, 트레이딩뷰에서 제공하거나 보증하는 것이 아닙니다. 자세한 내용은 이용 약관을 참조하세요.